
As a Google Workspace Admin, you pride yourself on having deep, accurate visibility into your domain. Thanks to powerful audit tools like GAT+, you have access to every login, file share, and configuration change across your organization.
You have the data. So why does reporting still feel like the hardest part of the job?
The issue isn’t a lack of information; it’s the Audit Gap.
The Audit Gap is the crucial disconnect between the raw, detailed data that IT needs for technical security and the high-level, visual, and strategic insights that management requires for decision-making. Sending a spreadsheet of 20,000 email records or 5,000 security logs to a manager doesn’t tell a story. It only creates confusion.
You shouldn’t have to be a data visualization expert just to communicate the security and health of your domain. It’s time to close that gap.
Where the Audit Gap Hits Hardest
When you rely on raw data and manual processes for reporting, critical blind spots emerge across your entire Google Workspace environment. Let’s look at where the Audit Gap is costing you the most.
Email Activity: Communication Patterns Lost in the Noise
Email remains the most-used communication channel across Google Workspace, yet understanding how it’s actually being used is surprisingly difficult.
Imagine this scenario: Your support team’s customer response times have doubled over the last month. Customers are complaining. Management wants answers. You pull the Gmail audit logs, and you’re looking at thousands of rows showing timestamps, sender addresses, and message counts.
The data is there. But can you quickly answer these questions?
- Which teams or departments are overwhelmed with incoming messages?
- How quickly are users responding to external emails?
- When is your domain busiest, and where are the bottlenecks occurring?
- Are workloads shifting, and if so, where?
Raw Gmail audit logs can tell you what was sent and when, but they don’t easily show you how communication is changing across your organization. Without visualization, you’re stuck manually sorting through spreadsheets, looking for patterns that should jump out immediately.
License Management: Paying for What You Don’t Use
Your budget depends on accurate licensing, but running reports to identify inactive accounts is tedious and error-prone.
The Audit Gap creates costly blind spots:
– Idle licenses go unnoticed: Manually cross-referencing activity reports to find users who haven’t logged in for months takes time and invites human error. That employee who left six months ago? Still consuming a license because their account is buried in row 2,847 of your export.
– Resource allocation becomes guesswork: Without visual context, you can’t see which Organizational Units are expanding fastest or consuming the most licenses. When budget planning season arrives, you’re making forecasts based on gut feeling rather than clear trends.
– Growth patterns stay hidden: Is your Marketing OU growing at 15% per quarter while Engineering stays flat? You won’t know unless you manually chart the data yourself. And by then, the budget cycle has already passed.
Security Risks: Threats Buried in Spreadsheets
Security isn’t about the number of alerts; it’s about recognizing risk trends quickly and communicating them clearly to stakeholders. Raw reports bury those critical patterns.
- – External group exposure goes undetected: Some security groups may be growing faster than expected or show unusual spikes in external members. A single spreadsheet row won’t highlight that risk immediately. By the time you notice it manually, unauthorized access may have already occurred.
- – Anomalous file sharing looks normal: A sudden spike in external file sharing within a sensitive OU could indicate a data leak or security incident. But when you’re looking at 5,000 rows of sharing logs, that spike becomes just another set of numbers, indistinguishable from routine activity.
- – Pattern recognition fails: The human brain isn’t built to spot trends in thousands of rows of audit logs. A chart would show you immediately that external sharing in the Finance OU tripled last Tuesday. A spreadsheet makes you hunt for it.
When data is hard to interpret, security visibility weakens. Risks go unnoticed until they become incidents.
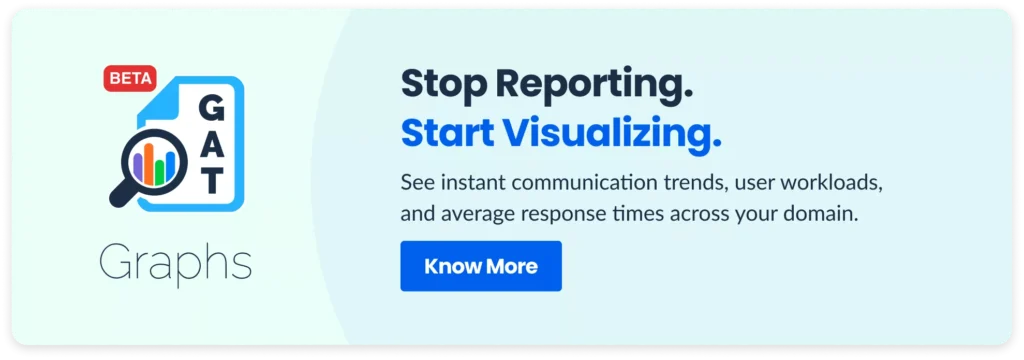
Closing the Audit Gap with GAT Graphs
After years of giving admins the deepest audit visibility through GAT+, we wanted to make that same trusted data easier to understand and share. GAT Graphs was designed to do exactly that. It turns detailed audit logs into visual, actionable insights your entire organization can interpret.
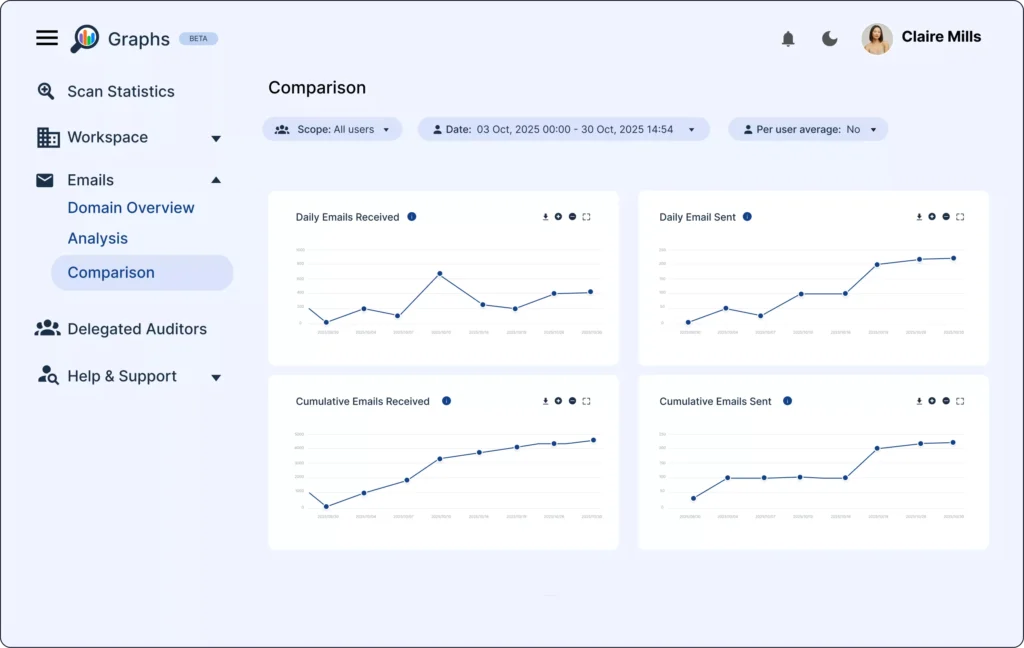
With this beta release, you can visualize how many emails are sent and received, how quickly teams respond to external messages, and when your organization is most active.
Compare how different users, groups, or OUs perform, and spot changes in communication load. See who is sending more, who is receiving less, and where response times are slowing. All of it is displayed through clear, interactive charts and heat maps for quick interpretation.
This is just the beginning of closing the Audit Gap across your entire domain. Based on feedback and interest from our customer base, more visual areas will be added over time to give admins even broader visibility into their environment.
The goal is not only better reports but also the visual clarity to make confident, strategic decisions and communicate your IT success effectively.
GAT+ gives you the data. GAT Graphs helps you tell the story.