Trusted by Hundreds of Companies and Protecting Millions of Users
GAT+ is the highest rated app in its class in the Google Workspace Marketplace, scoring 4.9/5.0 consistently
SOC 2 Certified GDPR Compliant
The Visual Edge for Your GAT+ Data
You already rely on GAT+ for the deepest, most trusted data visibility across your domain. Now, GAT Graphs gives that same audit power a visual upgrade.
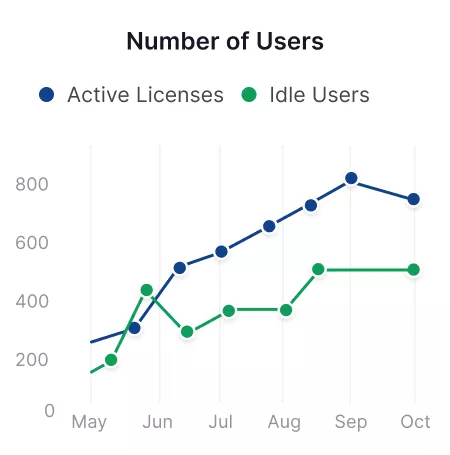
It’s the same accurate data you count on, presented in dynamic, easy-to-read charts that help you instantly spot patterns,
compare trends, and share insights across your organization.
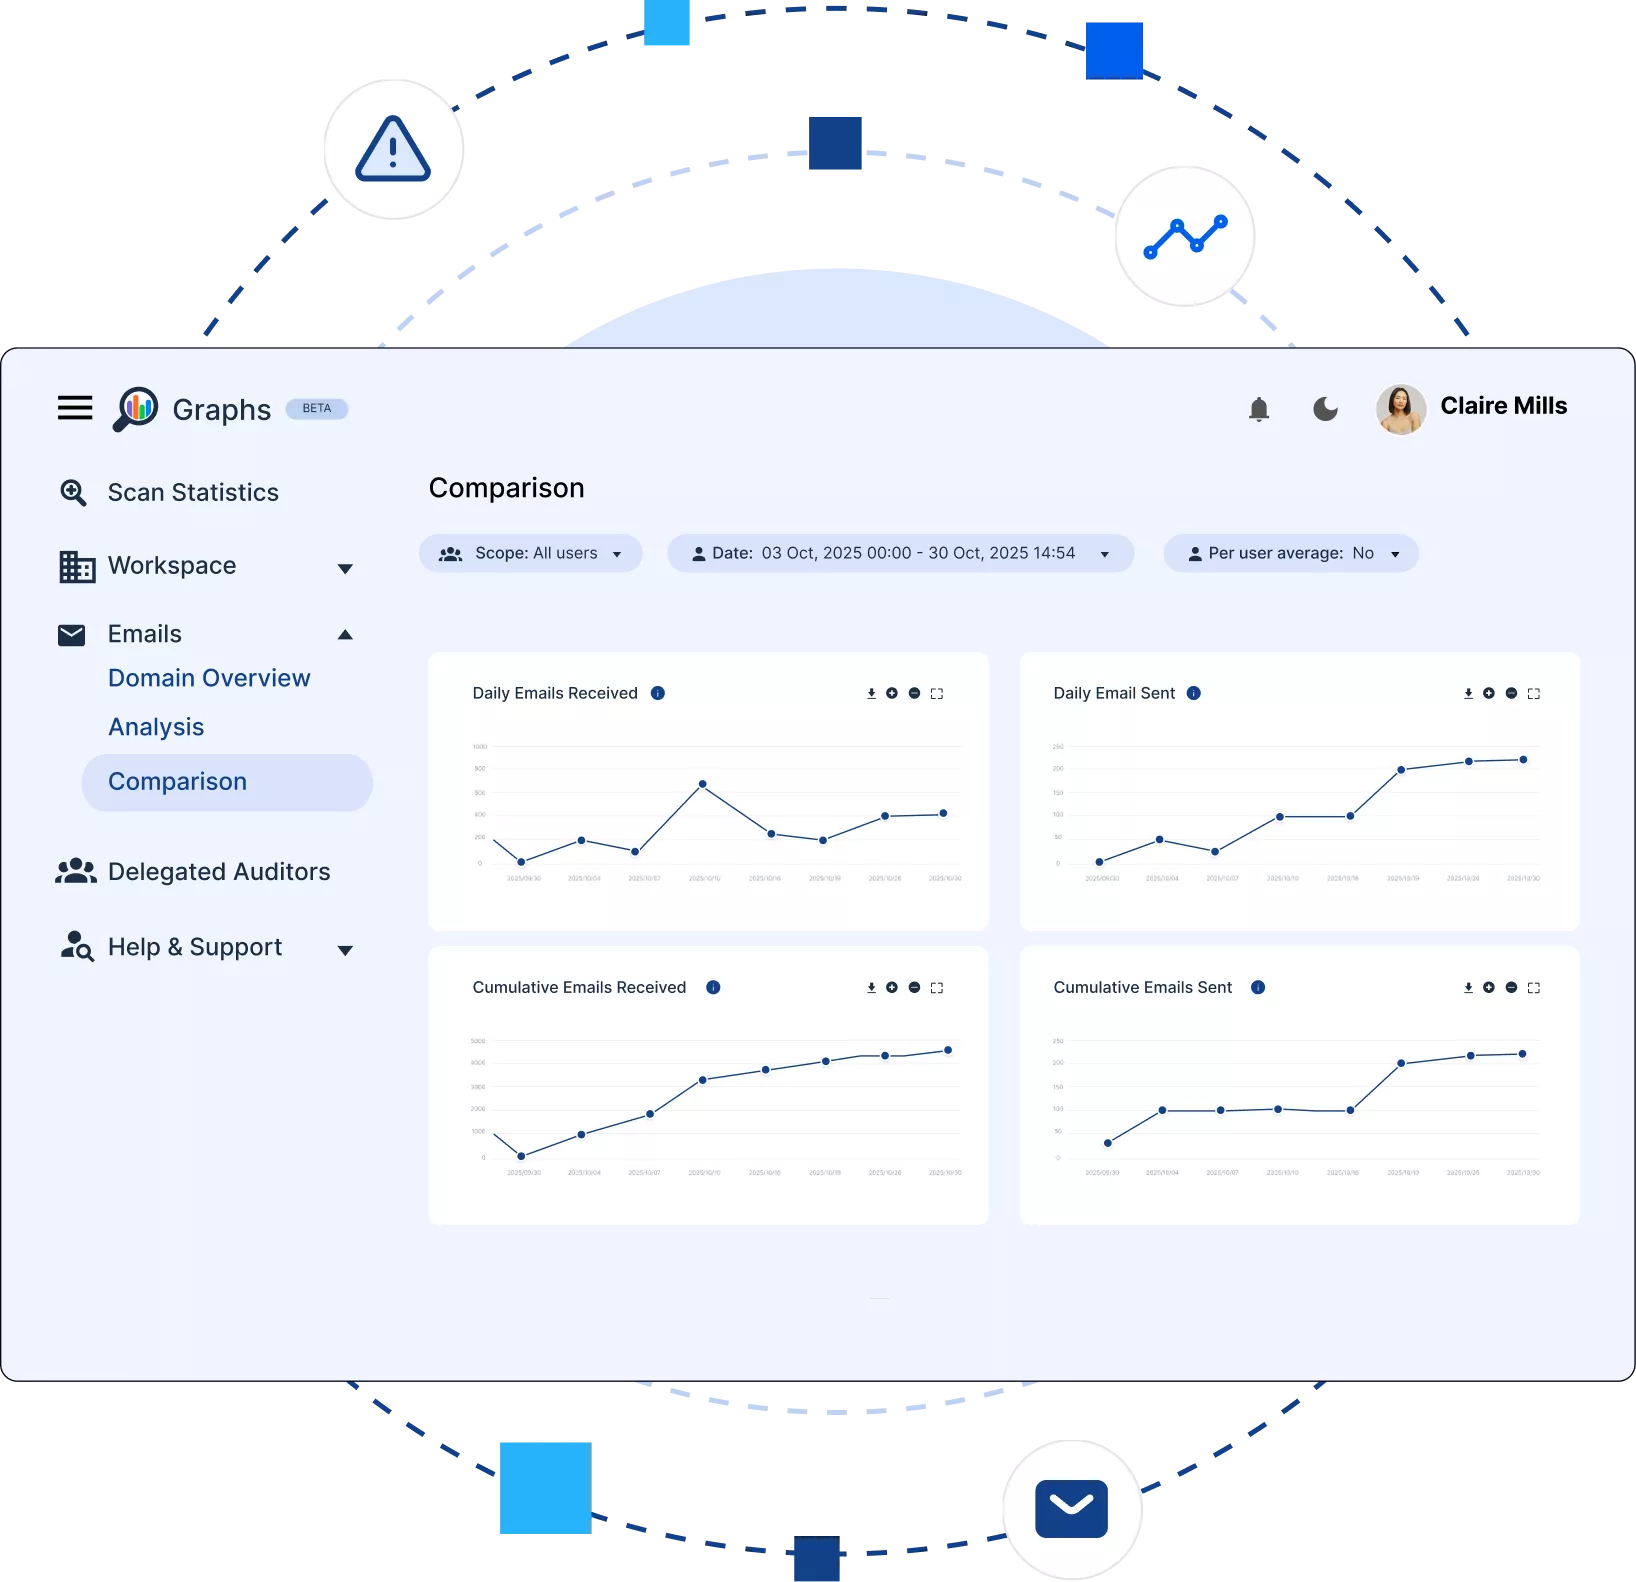
Turn Data into Clarity. Turn Clarity into Action.
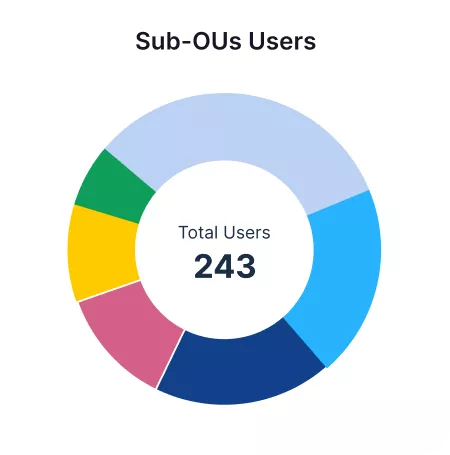
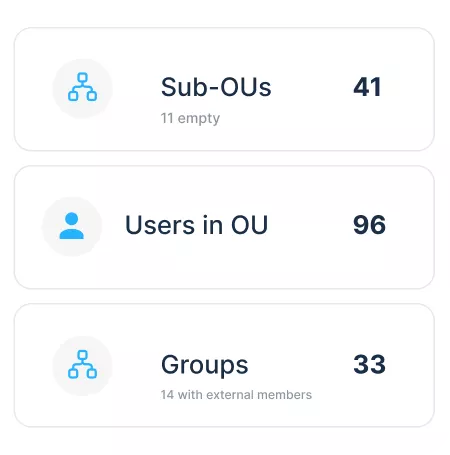
See your GAT+ data visualized in interactive dashboards (built on our new UI).
Present insights clearly to management and stakeholders, saving hours on manual formatting.
Save time on report building and analysis.
Turn complex audit data into visuals that make sense at a glance.
(Depending on feedback and interest from our customer base, more areas will be added over time)
Why Google Admins Will Love It
GAT Graphs is built for speed, clarity, and communication. It helps Google Admins and IT teams turn their day-to-day audit data into visual insights anyone can understand.
Instant Clarity: See email trends and activity in one view.
Professional reporting: Share visual summaries that are ready for management meetings.
Powered by GAT+ data: Every chart is based on verified audit data for complete accuracy and context.
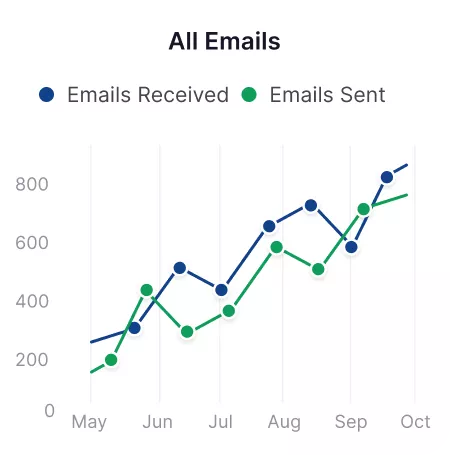
Email Analytics Made Simple
See how communication moves across your domain at a glance.
With GAT Graphs, you can visualize how many emails are sent and received, how quickly teams respond to external messages, and when your organization is most active.
Compare how different users, groups, or OUs perform, and spot changes in communication load. Who is sending more, who is receiving less, and where response times are slowing.
All data comes directly from GAT+ audits and is presented through clear, interactive charts.
GAT+ gives you the data. GAT Graphs helps you tell the story.
Trusted Visibility: What Google Admins Say About GAT
“Great system for monitoring and managing your G Suite environment. Great tool for locating and correcting external shares. Really good for detailed Chrome user reporting. The ability to set firewall type rules in a centralized fashion for any chrome browser is very useful. Support has been very good as well.”
Greg Langham
“Gat+ has proved invaluable in the management of the Google estate. Love the new interface and looking forward further development in the functionality as the importance of access controls, audit and standard processes expand. Very helpful support staff always available and able to assist.”
Chris Carney
“GAT is an excellent tool to work with and is indispensable to the daily operations of our organization. It makes it very easy to pull the data that we need to make our reports. Support is always extremely responsive on any issues or questions that we may have. Great auditing and reporting tool!”
Adam Klesitz
“Gat+ has proved invaluable in the management of the Google estate. Love the new interface and looking forward further development in the functionality as the importance of access controls, audit and standard processes expand. Very helpful support staff always available and able to assist.”
Chris Carney
Ready to Stop Reporting and Start Visualizing?
Start getting the clarity you need in seconds.
Schedule a personalized demo today to see the new UI, explore the dashboards, and learn how GAT Graphs will immediately solve your reporting challenges.