

The GAT Shield dashboard is your central hub for monitoring Chrome browser activity across your Google Workspace domain.
It offers real-time insights through visual graphs, user statistics, and triggered alerts, helping Admins detect risky behaviour, monitor productivity, and investigate incidents.
You can explore activity by user, group, or organisational unit, and filter data by time frame, activity type, or security event.
1. Select Time Frame #
To begin, set the time frame for your analysis. This determines what data the dashboard will display.
You can choose from:
- Today – data for today’s dashboard
- Yesterday
- Last 7 days
- Last 14 days
- Last 28 days
- This month
- Previous month
- Custom – select a custom timeframe for the dashboard data.
2. Filter by Affected Users #
Next, decide which users you want to analyse. You can target:
-
All Users
-
Groups
-
Organisational Units
-
Specific Users
This allows you to narrow down activity by team, role, or individual.
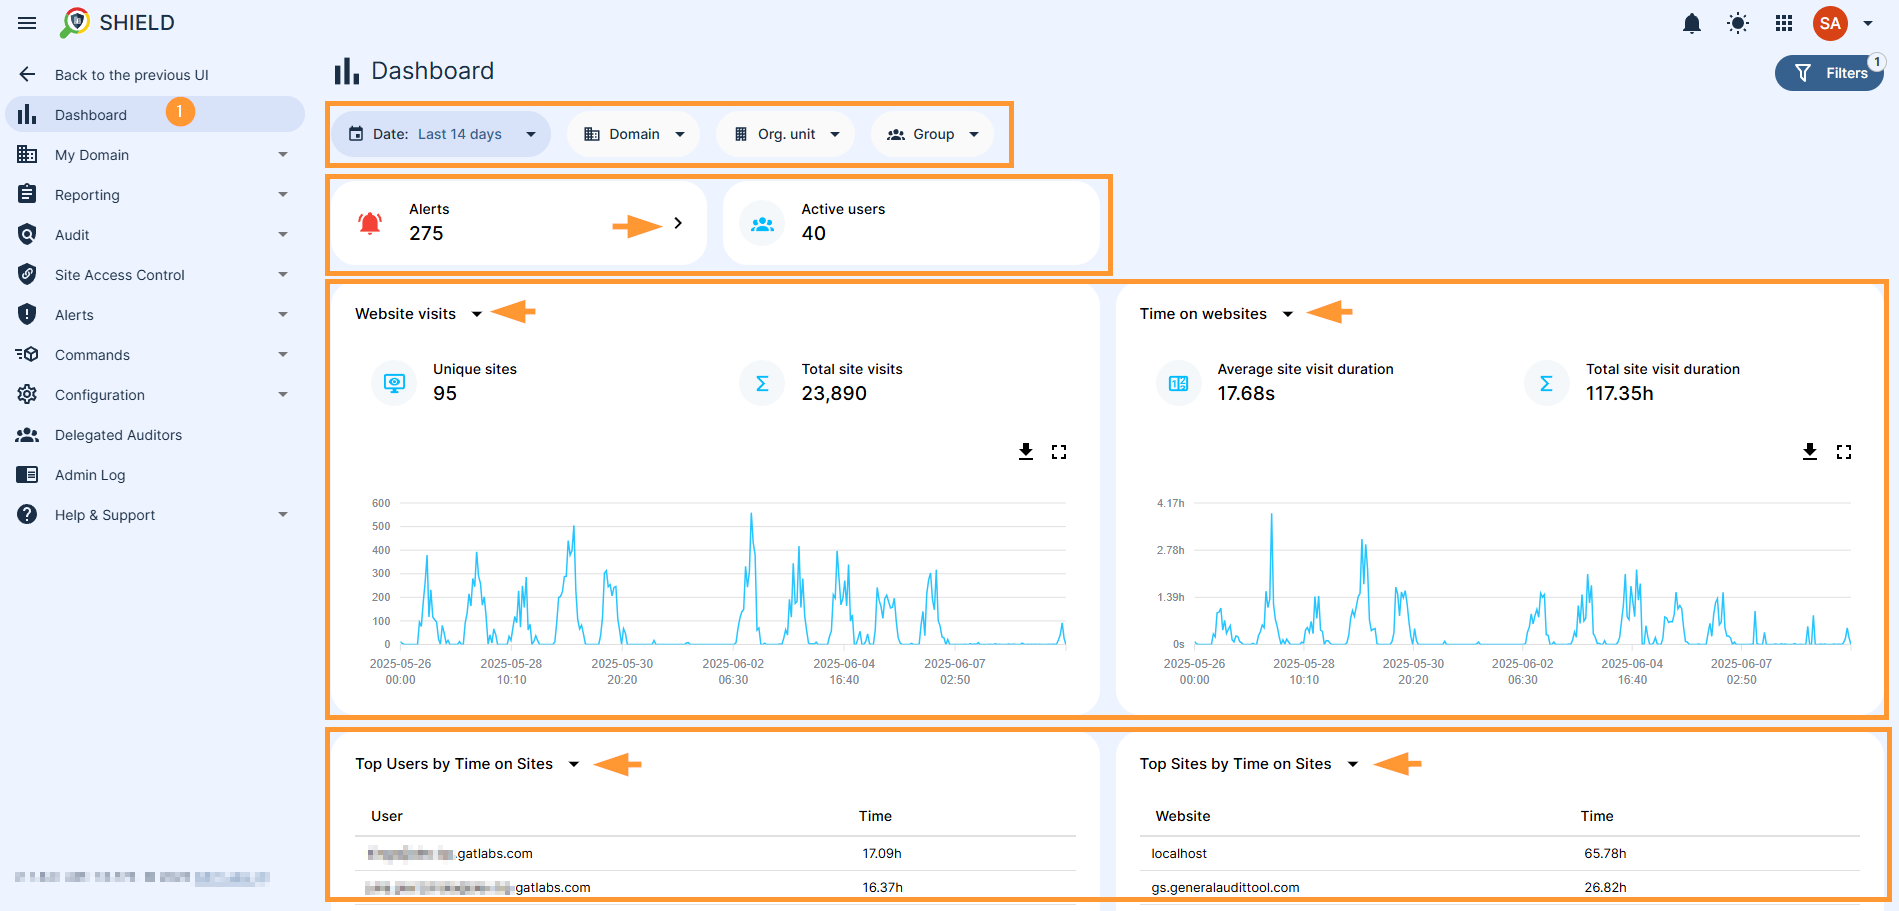
3. View Triggered Alerts #
The Alerts section shows any security or behaviour-based alert rules that were triggered during the selected time frame.
Click on an alert to view full context: user, time, triggered rule, and resulting action (if any).
4. Visualise Key Metrics in the GAT Shield Dashboard #
The GAT Shield dashboard offers clear, exportable charts to help Admins spot trends and act on key insights.
Data can be downloaded in PNG, SVG, or CSV format.
Key Metrics You Can Track:
- Active Users: See the number of active users for different times through the selected time frame.
- Alerts: Quickly identify trends in security alerts, allowing you to pinpoint and address recurring issues or potential threats.
- Downloads: Monitor the volume of files being downloaded across your domain, displaying unique downloaded files as well as total downloaded files in volume, helping you track data ingress and potential exfiltration.
- Download Sizes: Understand the total size of downloaded content, offering another layer of insight into data transfer activities.
- Extension Installs: Visualize the frequency of Chrome extension installations, which can help you identify popular tools or potentially unauthorized add-ons. View the unique installed extensions and total installed extensions for the chosen time frame.
- Extension Removals: View the “unique removed extensions” and “total removed extensions” for the chosen time frame.
- Internal Chats: Track the volume of internal chat communications, providing insights into team collaboration and information flow within your organization. Check the number of unique chats as well as total chats for the time frame.
- External Chats: Monitor interactions with external parties through chat, crucial for data loss prevention and compliance.
- Website Visits: Get a visual overview of the number of unique visited websites as well as total site visits for the selected time frame, helping you understand the browsing habits of the users
- Time on Websites: See the average site visit duration and total site visit duration for the selected date range.
5. Switch to List View for Deeper Analysis #
For a deeper analysis, switch to ‘List View’. This view breaks down user-level activity and gives you powerful filtering tools.
Depending on the selected time frame, you’ll see rich statistics like:
Website and Browse Activity: #
- Top Categories being blocked: Shows which website categories are most frequently prevented from being accessed by users, highlighting common attempts to visit restricted content.
- Top Categories being warned: Identifies website categories that trigger warnings for users, indicating areas where users might be pushing policy boundaries or encountering potentially risky content.
- Top Sites by Site Views: Reveals the most frequently visited websites across your domain, offering insights into popular online destinations, as well as the number of visits.
- Top Sites by Time on Sites: Highlights the websites where users spend the most combined time,, useful for understanding engagement and potential productivity drains.
Extension Management: #
- Top Extensions by Install: Displays the most commonly installed Chrome extensions, helping identify popular tools and potential security risks.
- Top Extensions by Removal: Shows which extensions are most frequently uninstalled, which can indicate issues with specific extensions or user preferences.
Security and Alerts: #
- Top Shield Alerts by Executions: Ranks the most triggered security alerts in Shield, allowing administrators to quickly identify and address recurring security incidents or policy violations.
User-Specific Activity: #
- Top Users being blocked: Identifies users who are most frequently blocked from accessing websites, indicating potential policy violations or targeted browsing.
- Top Users being warned: Shows users who receive the most warnings for their online activity, suggesting they may require additional guidance or attention.
- Top Users by Downloads: Lists users who download the most files, which can be important for monitoring data exfiltration or suspicious file transfers.
- Top Users by Download Size: Ranks users by the total size of their downloaded files, providing a different perspective on download activity.
- Top Users by Extension Installs: Identifies users who install the most Chrome extensions, which might indicate a need for further investigation into their extension usage.
- Top Users by Extension Removals: Shows users who remove the most extensions, which can sometimes indicate attempts to bypass security measures or troubleshoot issues.
- Top Users by External Chat: Tracks users engaging in the most external chat conversations, useful for monitoring communication with outside entities.
- Top Users by Internal Chat: Highlights users with the highest volume of internal chat activity, providing insights into collaboration patterns.
- Top Users by Shield Alerts: Identifies users who trigger the most GAT Shield alerts, indicating recurring security concerns or policy breaches by the users of the domain.
- Top Users by Site Views: Shows which users visit the most websites, indicating the broad browsing habits of the users
- Top Users by Time on Sites: Ranks users by the total time spent browsing websites, offering insights into individual online engagement.
Related Articles #
FAQ #
Q: Can I export dashboard data from GAT Shield?
Yes. You can export all charts and tables in PNG, SVG, or CSV format for documentation or sharing.
Q: What’s the difference between Graph View and List View?
Graph View shows visual trends across your domain. List View provides detailed stats by category, site, or user, better for investigations and policy analysis.
Q: Can I drill into user-specific activity?
Yes. Use filters to isolate individual user data and view their alerts, downloads, chats, and browsing behaviour.


