

How to view the performance activity of users on Google Chrome? #
GAT Shield can show the time spent on a certain web page or series of web pages by all users.
View the information for the entire domain.
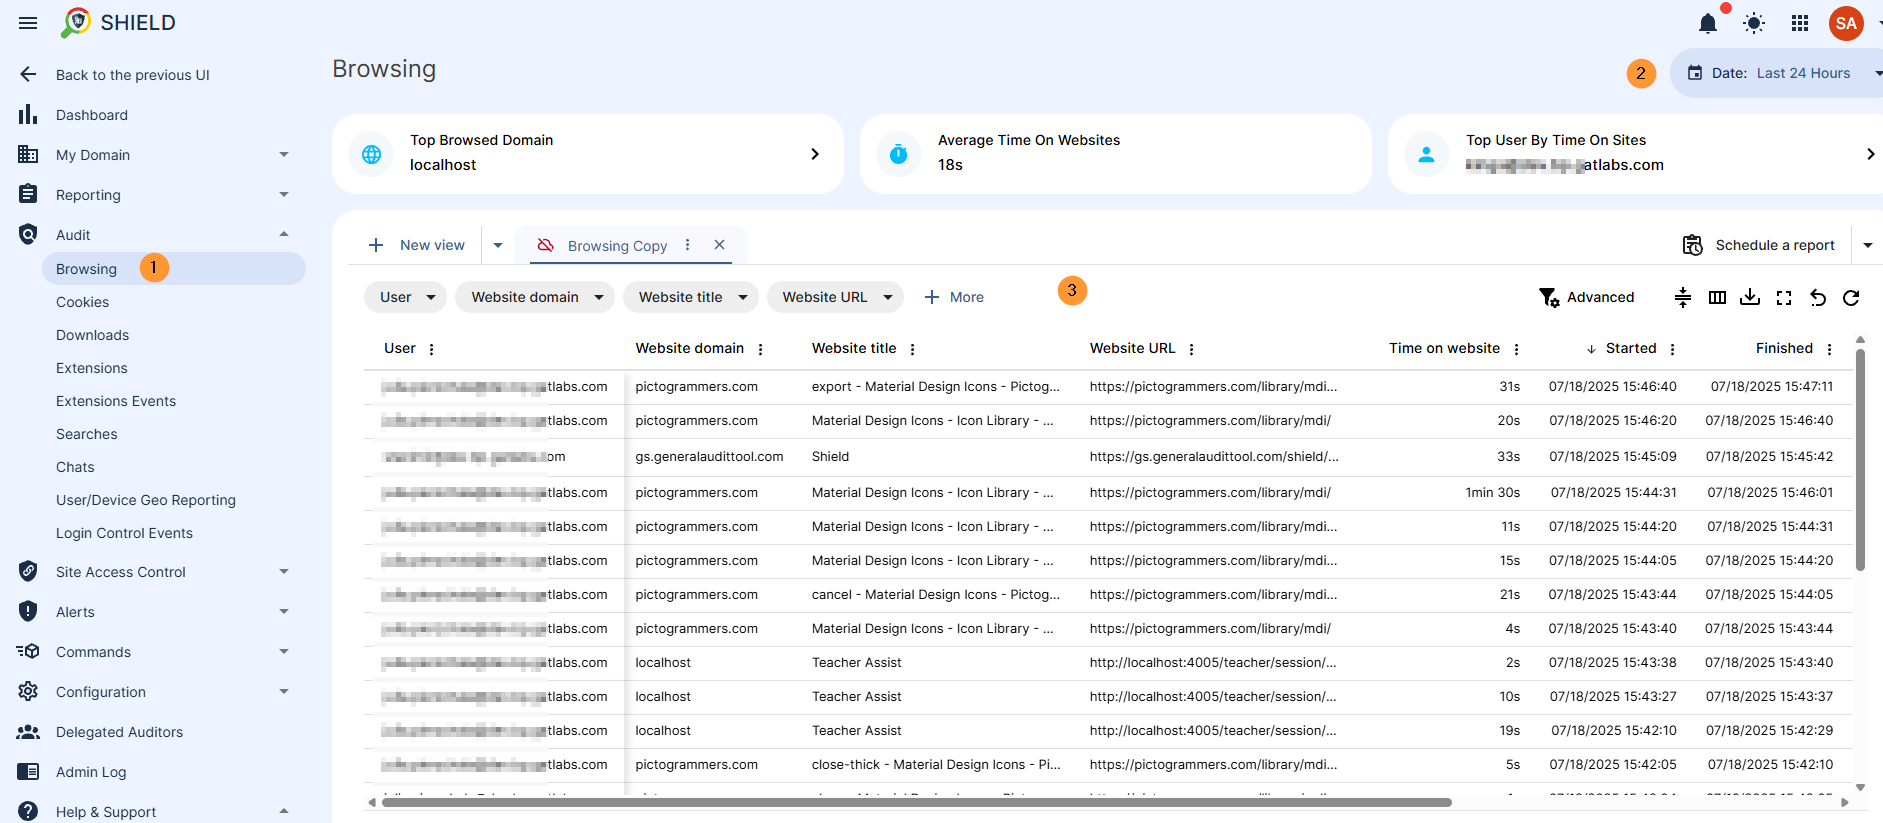
Browsing audit #
The browsing section will display all the websites visited by all Shield users by showing the time spent on them as all other detailed information.
Navigate to Audit > Browsing and view all the webpages the users visited.
By selecting the Data in the top right corner, you can filter different time frames you want to audit the browsing activity for.
Time on website #
The Time on site field shows exactly that – the time spent on each visit to the particular website.
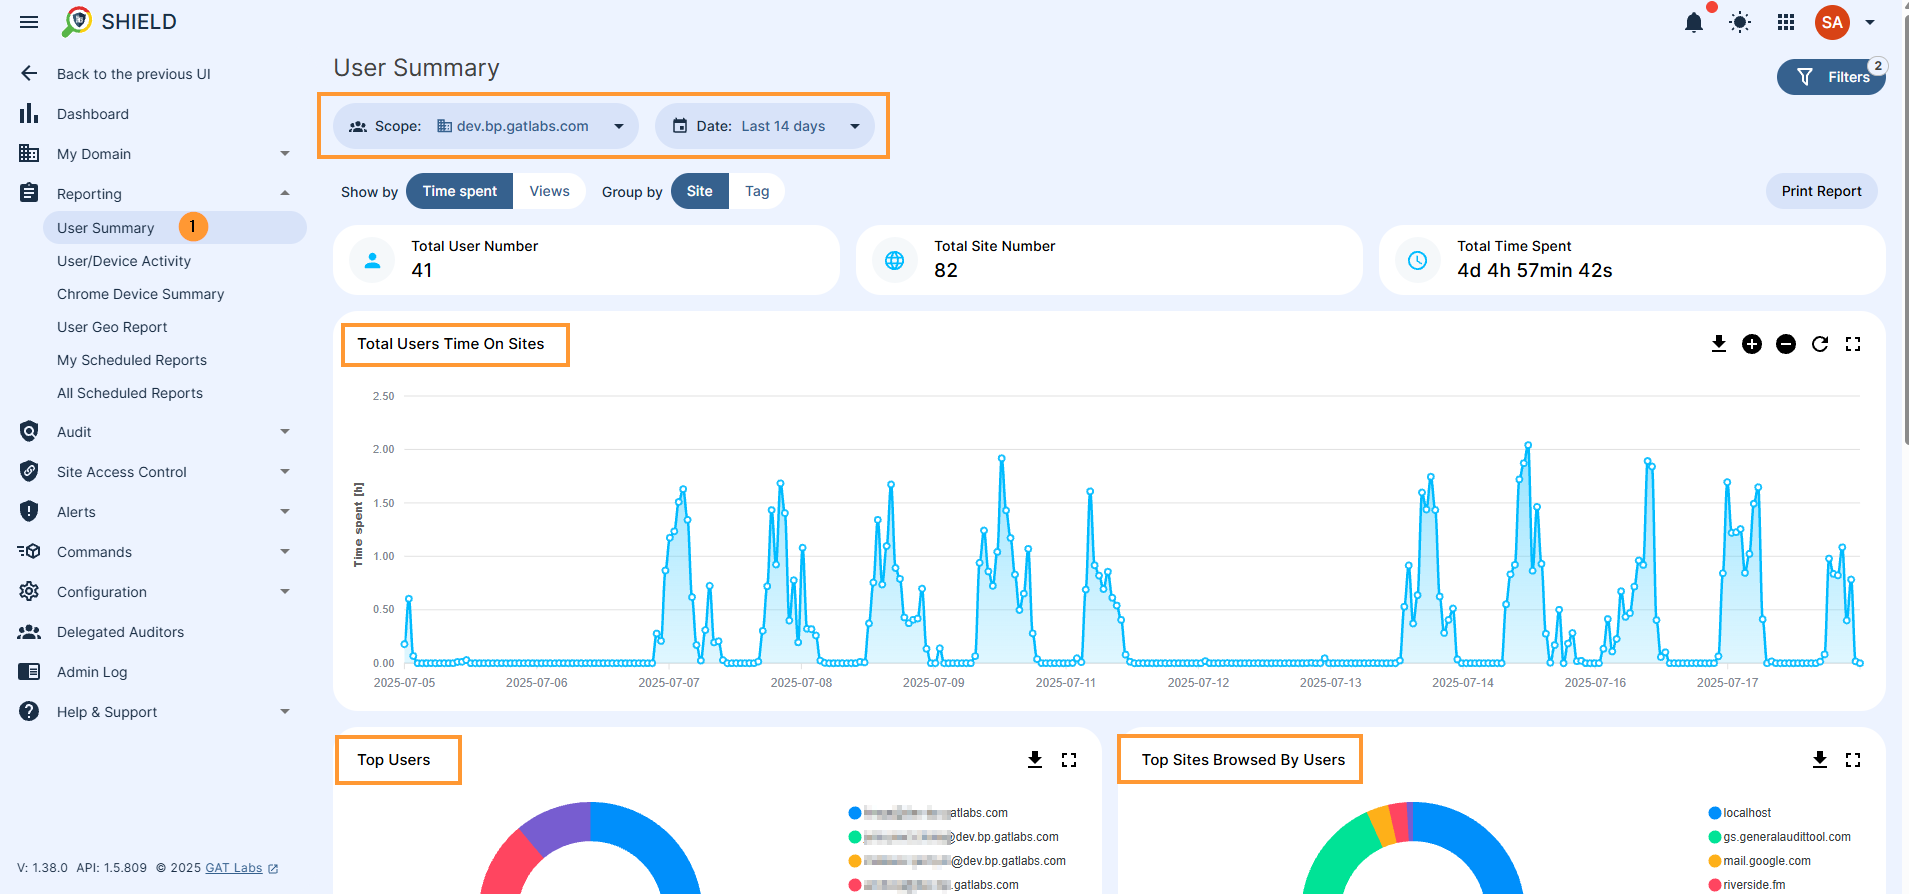
User summary #
The User summary allows you to filter for a specific set of users and see their browsing activity.
In the Scope button, select the users you are searching for. It could be user/group/ogr. unit of users or domain.
In the Date button, select the time frame for which you are looking for the user summary.
View the total users’ time on site, Top users as well as Top sites browsed by users.
All data can be printed and exported.
Result #
GAT Shield provides a comprehensive and detailed audit of the users’ browsing activity for each and every user of the domain.


