
Audit Site URLs in GAT Shield with Browsing Tags #
GAT Shield is a Data Loss Prevention solution where a Google Workspace Super Admin can view and audit a user’s browsing and location activity while logged into the domain.
You can assign tags to websites to group them into categories (like tagging LinkedIn, Facebook, and TikTok as “Social”).
This lets you filter and track user browsing based on those categories, making it easier to see how much time is spent on different types of sites. This enhances reporting capabilities in GAT Shield.
Data Explorer #
The admin of the domain can use the Browsing section in GAT Shield to audit several datasets for any user.
One of the datasets that can be audited is the site that a user has visited.
This section displays a graph and some pie charts representing the time users on your domain spent on sites, the sites they visited, and the site views per person.
Site URLs #
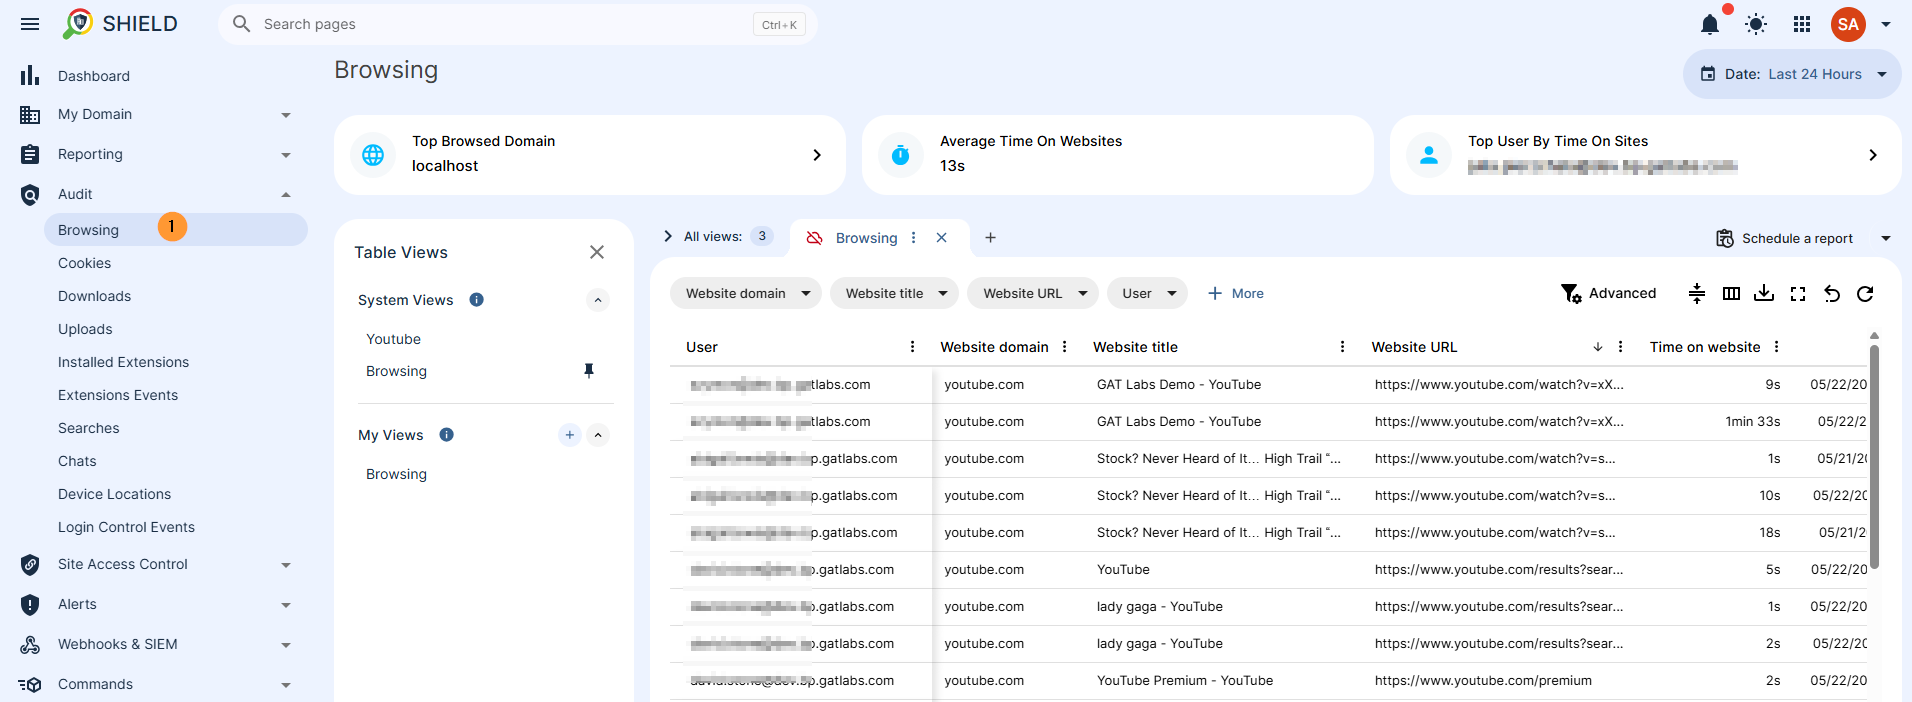
To check this data, navigate to the GAT Shield > Audit > Browsing.
Filter for what you need.
- Website domain
- Website URL
- Website title
- User
- Etc
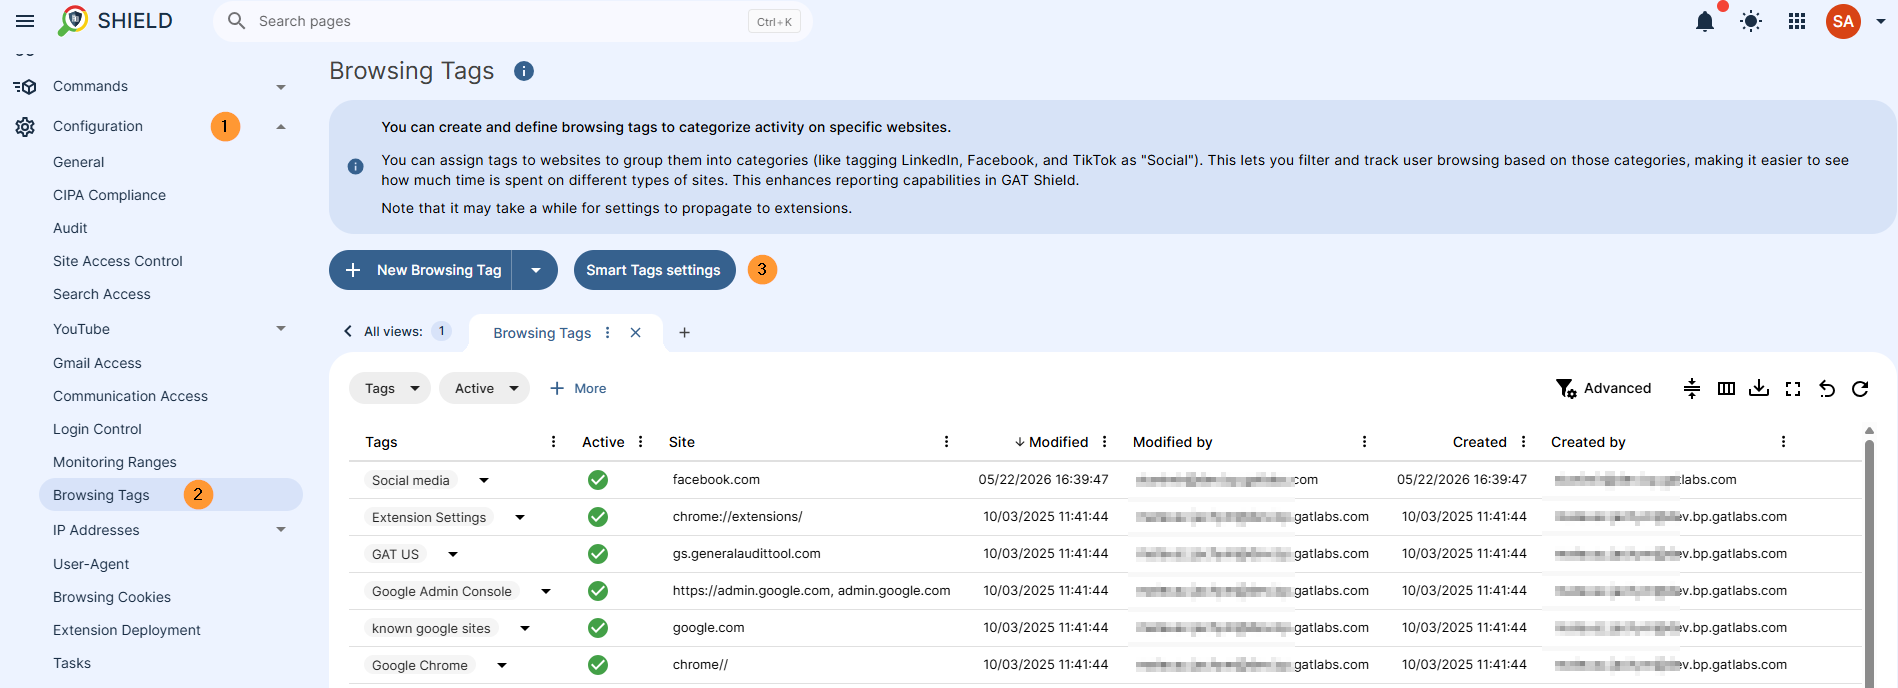
Browsing Tags #
One drawback of this function is that it is very specific, as the site URL is only one particular part of a site.
However, GAT has a way around this, too, using ‘Browsing Tags’
Browsing Tags allow the user to enter a more general rule for auditing time on a specific site.
For example, the admin can create a browsing tag called ‘News’ and add the ‘bbc.com’ and others into a Tag.
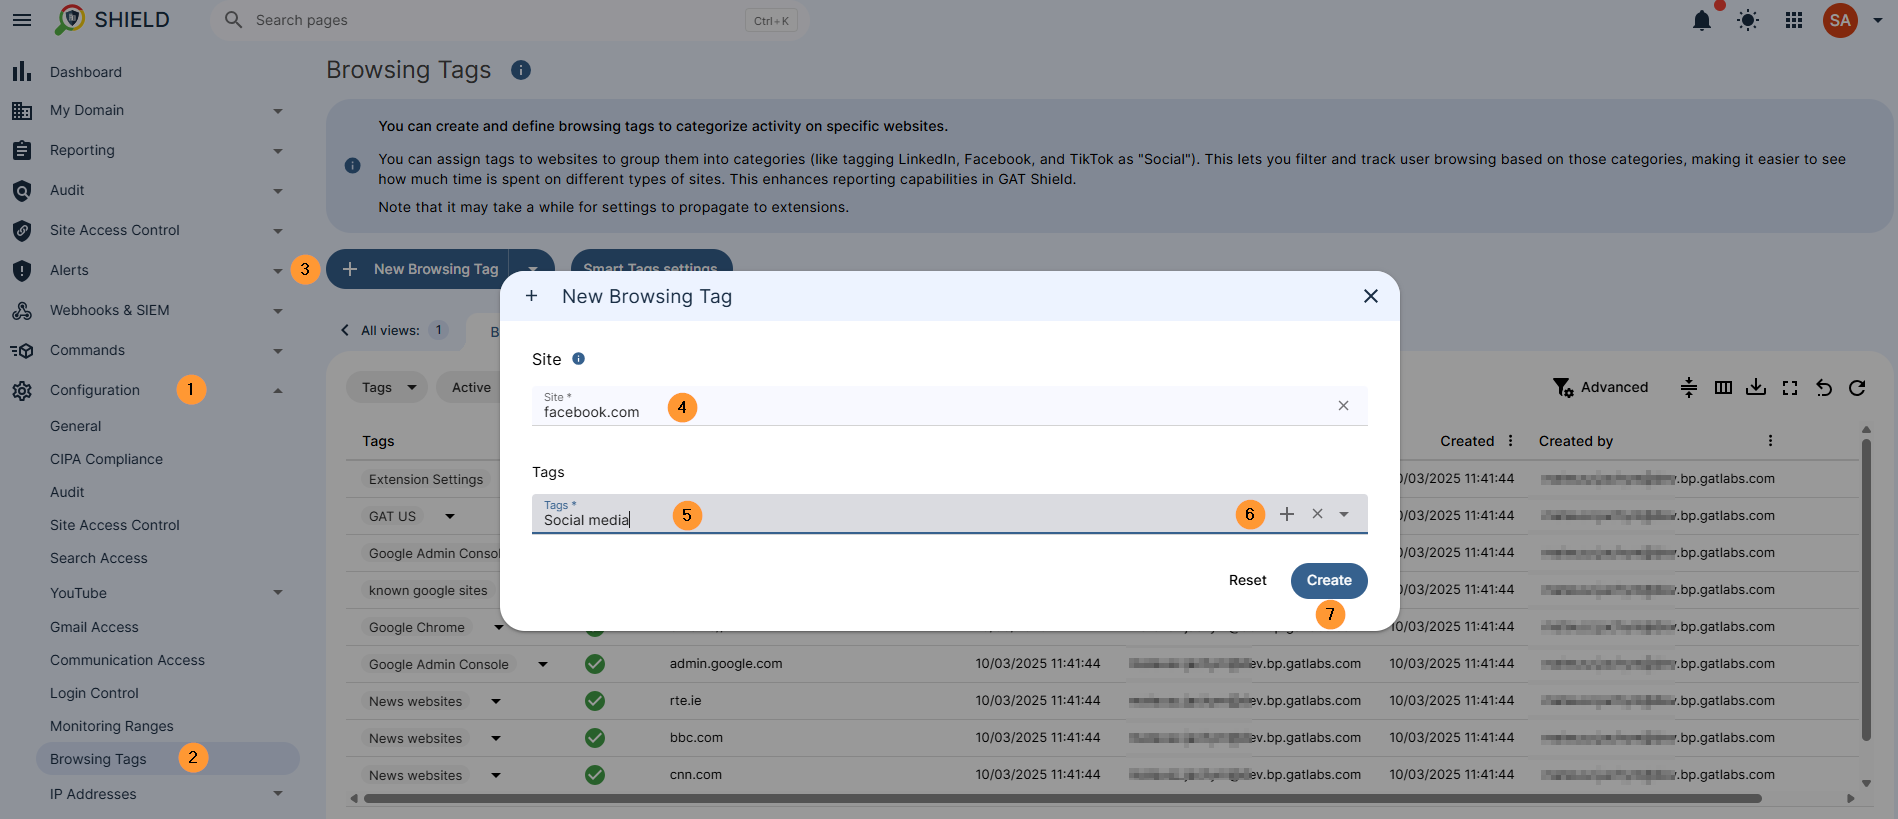
Create tag #
Navigate to GAT Shield > Configuration > Browsing tags > New browsing tag
- Site – enter site URLs
- Tags – enter a tag for the sites added
- + Click on the + (plus) button to add the tag
- Create – click to create the tag
NOTE: Tags you create will always be case-sensitive.
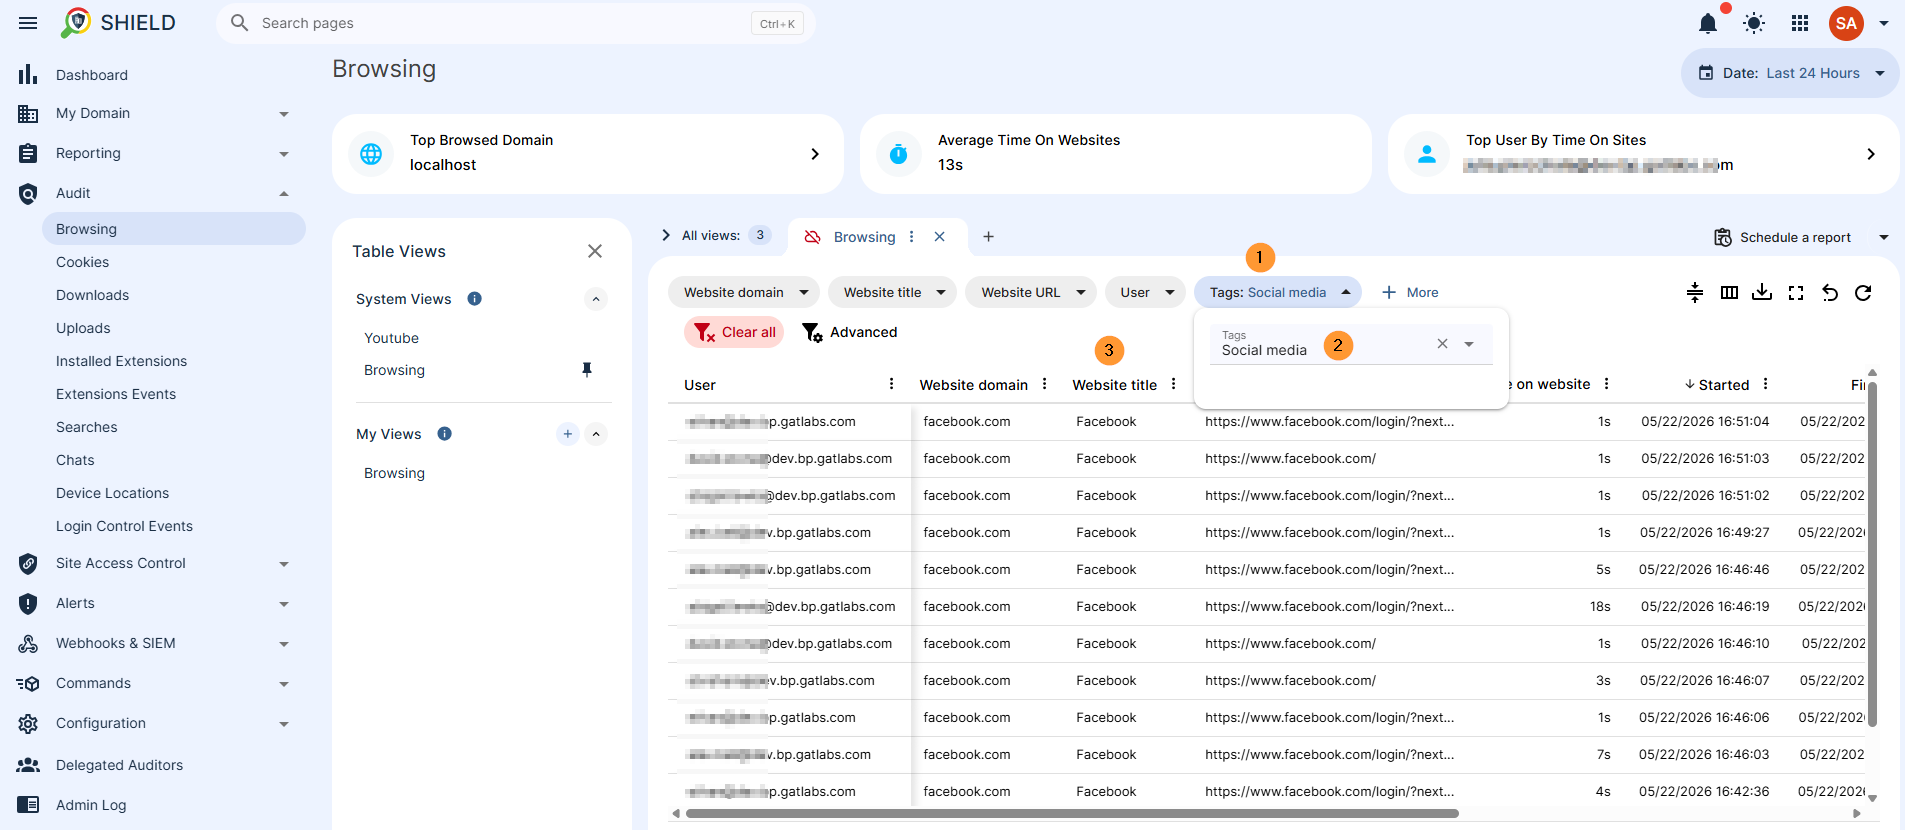
Search for the sites by filtering by the Tag
When users visit the site “facebook.com,” the Tag will be assigned and filtered by.
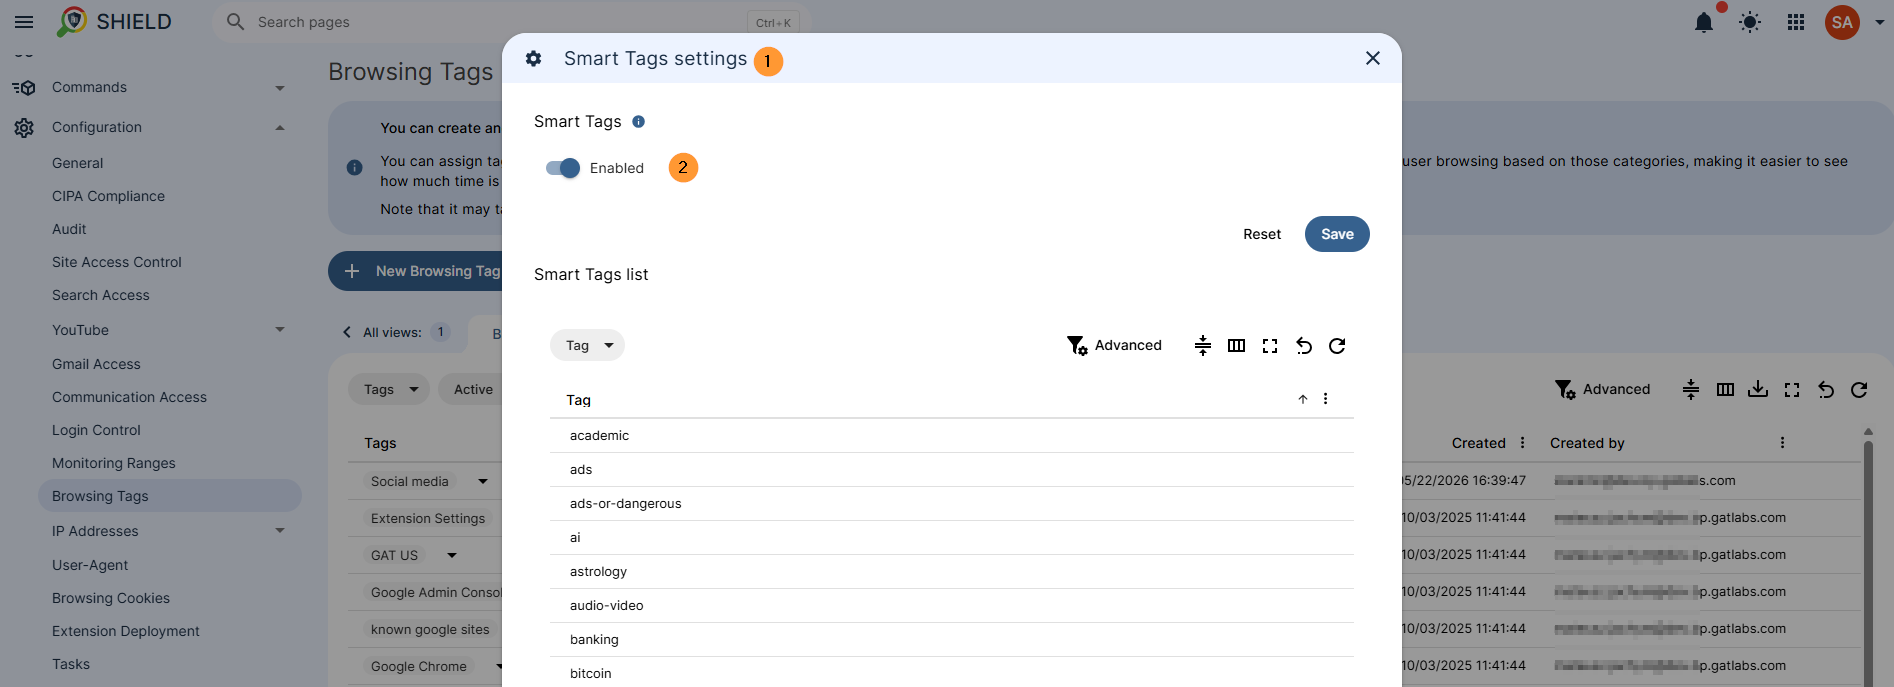
Smart tags #
This feature automatically applies system-defined browsing tags to your traffic.
Our built-in tag database is dynamic and continually updated to ensure the most accurate categorization.
As the users are browsing pages, the Smart tags are automatically assigned to the sites.
It can be enabled or disabled for your domain.
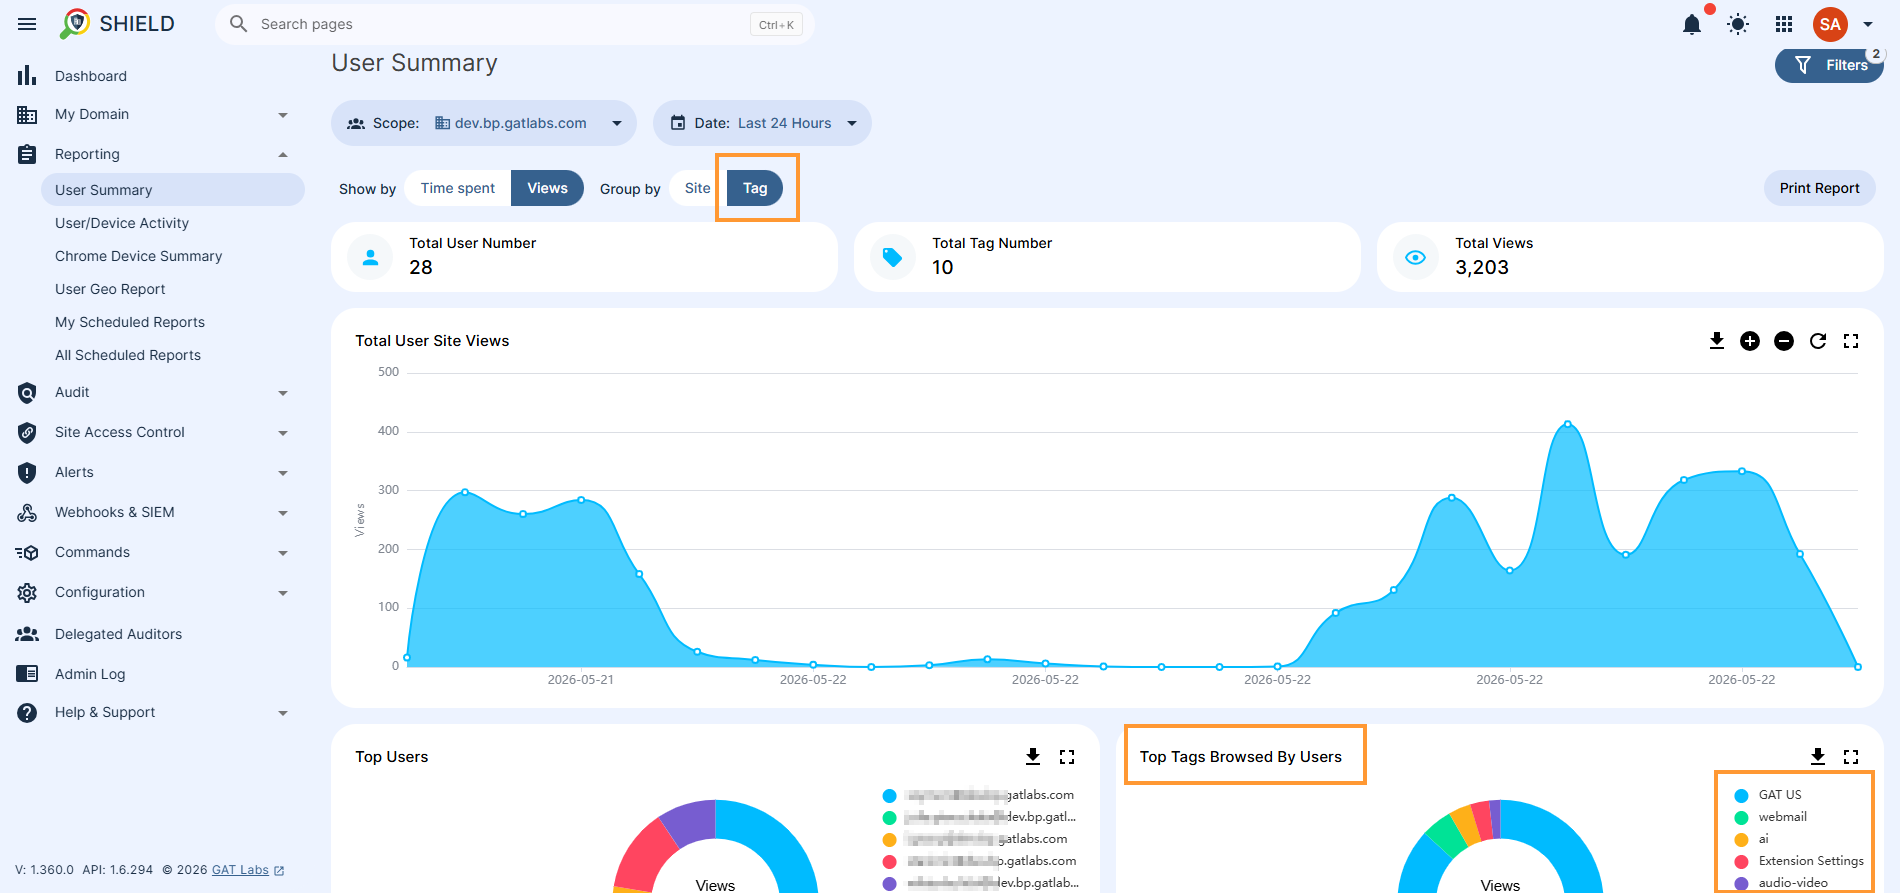
View Tags data #
The tags can then be filtered within the tool.
For example: In Reporting > User summary > Tag
View all the browsing activity and user summary for the scope of users filtered by the custom and smart tags