

Streamlining Security with GAT+ SIEM Integration #
In a modern enterprise environment, security analysts often manage dozens of fragmented software tools, from SaaS platforms and cloud providers to firewalls and endpoint protection.
Expecting a team to monitor 20 different dashboards simultaneously isn’t just inefficient; it creates “data silos” where critical security patterns can be missed.
To solve this, GAT+ offers a powerful SIEM (Security Information and Event Management) and Webhook integration.
This feature allows you to export real-time GAT+ security alerts directly into a centralized external system such as Splunk, ElasticSearch, or a Generic Webhook receiver.
Why Use a SIEM Sink for Your GAT+ Alerts? #
The primary goal of this integration is contextual visibility. By streaming GAT+ alerts into your central SIEM, you can correlate Google Workspace activity with other infrastructure logs.
-
The Practical Benefit: Imagine GAT+ triggers an alert for “Mass File Downloads” on a specific user account. Without integration, that’s an isolated event. With SIEM integration, an analyst can immediately see, on the same dashboard, that the same user just logged in from an unusual IP address via the corporate firewall or triggered a high-risk event in a different SaaS app.
By bridging the gap between GAT+ and your external security stack, you transform isolated notifications into actionable intelligence.
How it Works: The Setup Overview #
The process involves three main phases, which we will detail in this guide:
- Creating the Sink: Defining where the data goes (URL) and how it authenticates (Authorization Tokens).
- Connecting the Alert: Mapping your existing GAT+ Alert Rules to your newly created “Sink.”
- Verification: Monitoring the GAT+ logs to ensure a successful “handshake” between GAT+ and your external reading system.
Navigate to GAT+ Configuration > Webhooks & SIEM.
In the Sinks, click on the (+) sign and add a new sink.
Fill in the details for the sink you want to add.
Type – select the type needed:
- Elastic search
- Splunk
- Generic receiver
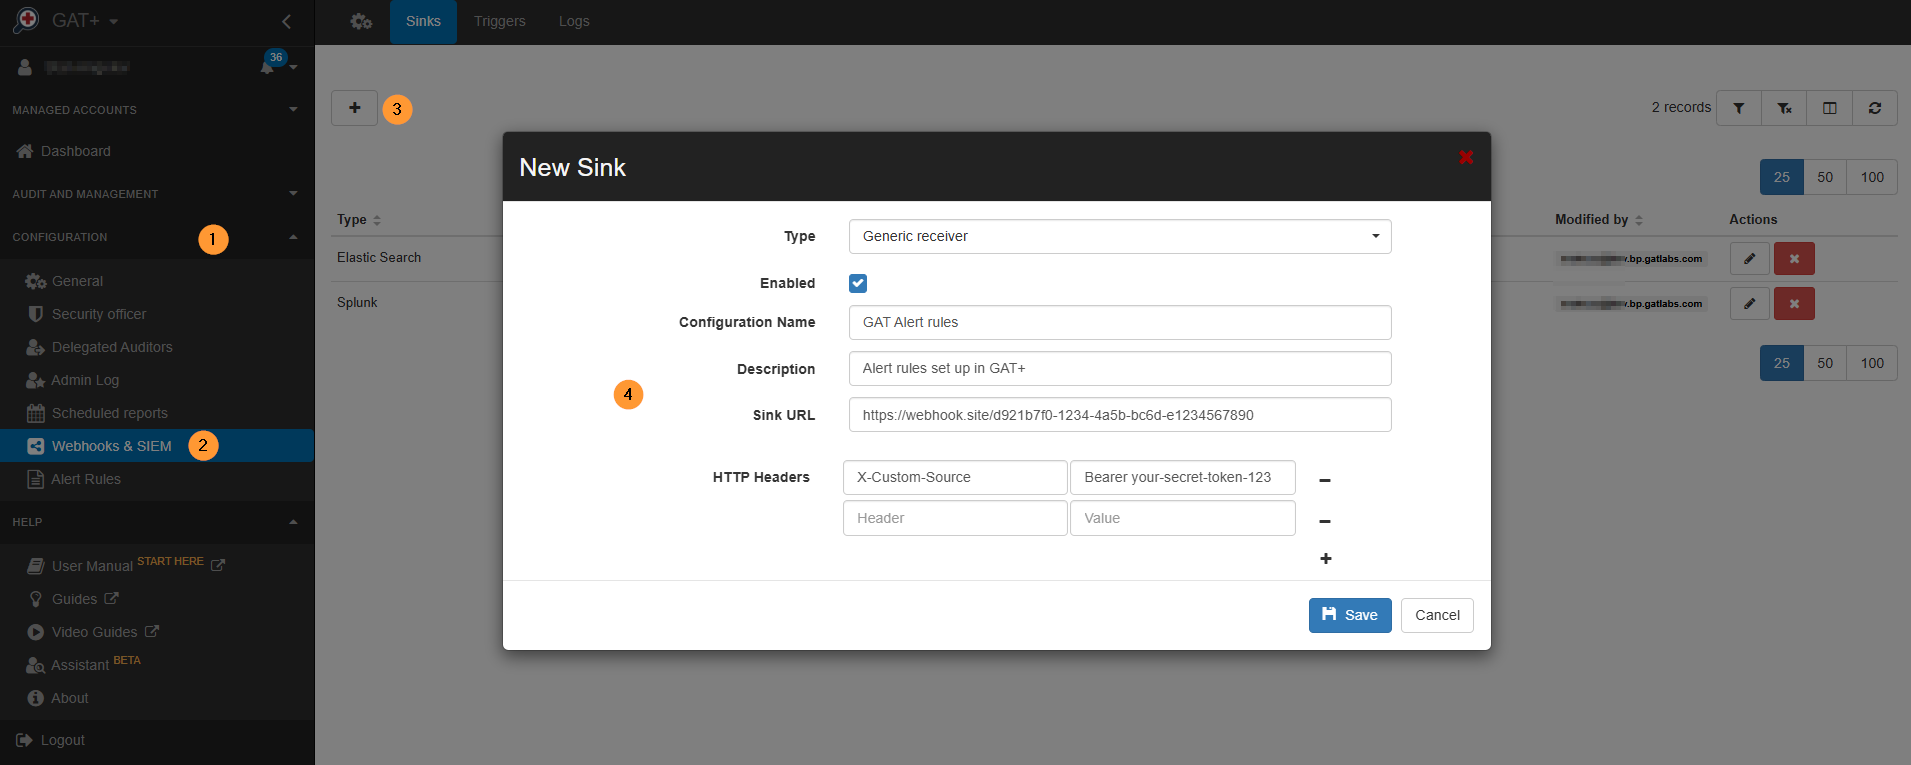
Generic Receiver #
Enable – enable or disable the sink – in the example below, for the Generic receiver.
- Configuration name – enter name
- Description – enter description
- Sink URL – enter a URL for the sink
- HTTP Headers – enter – Header and Value
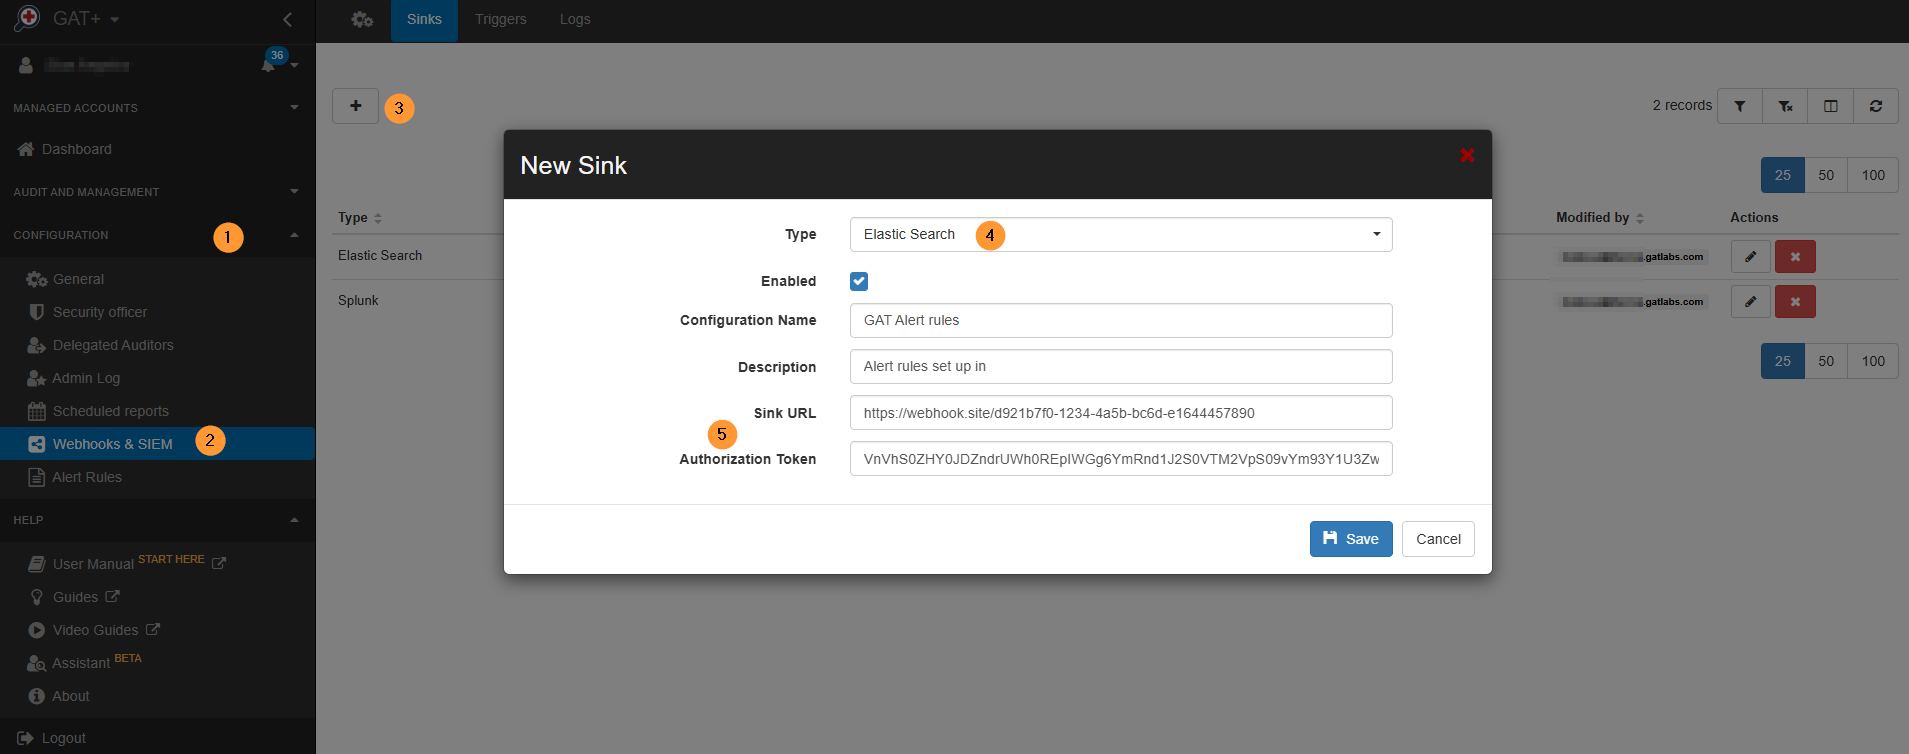
Elastic Search and Splunk #
Elastic Search and Splunk will require an Authorization Token.
- Type – Elastic Search or Splunk
- Enabled – enable or disable
- Configuration name – enter a name
- Description – enter a description
- Sink URL – enter the URL
- Authorization Token – enter the Authorization token
- Save – click to save
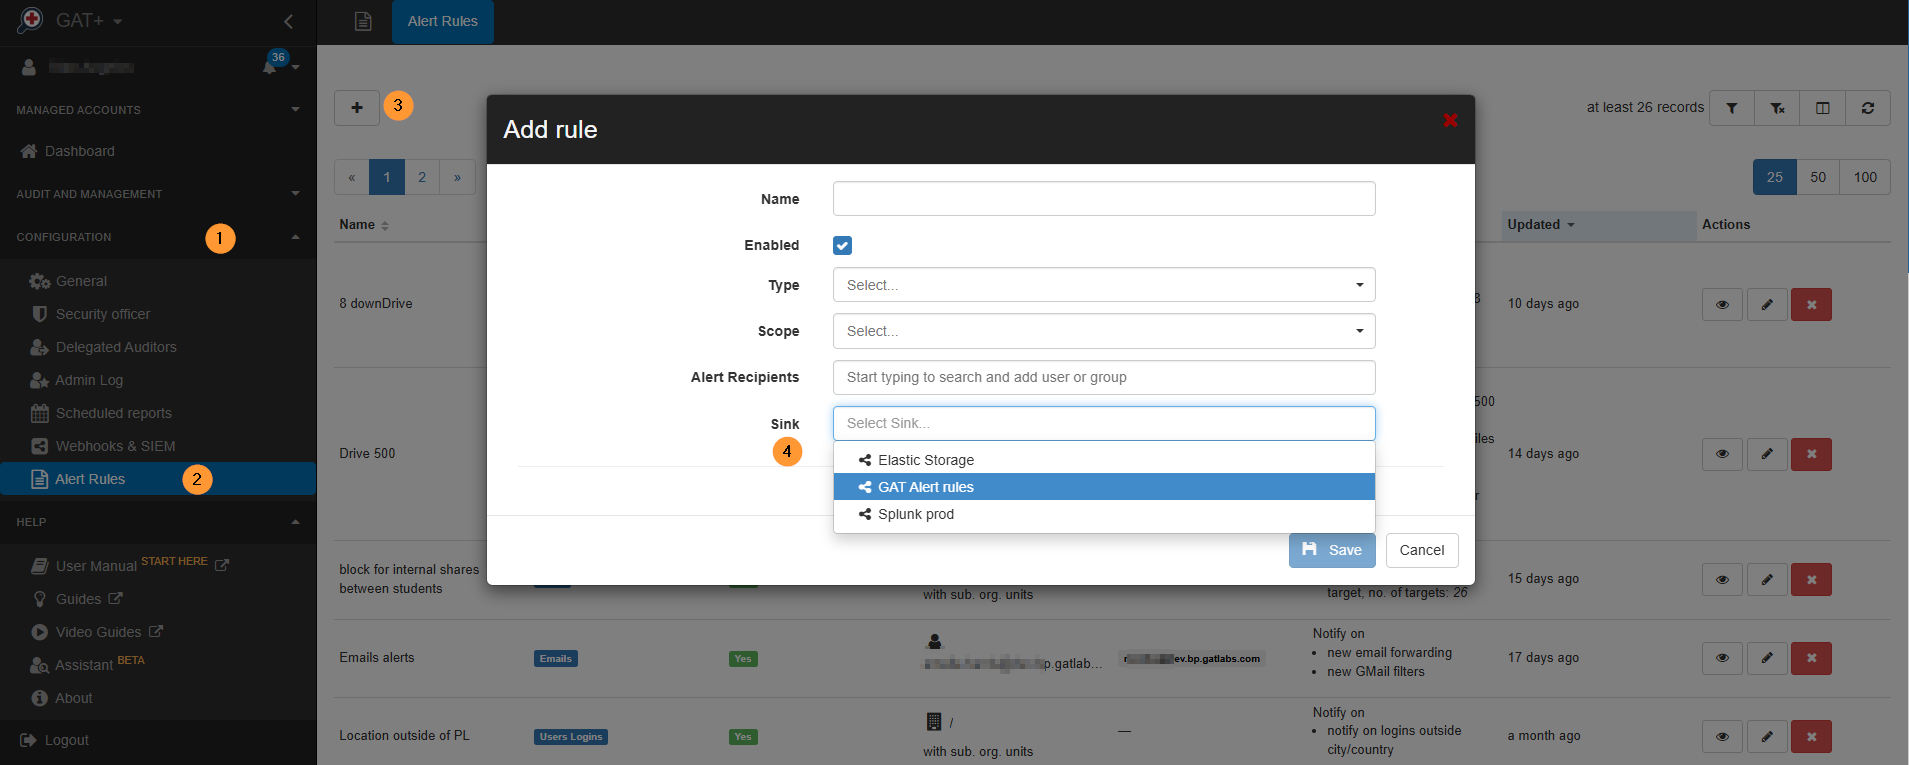
Use of Webhooks and SIEM in GAT+ #
The webhooks created can be used in GAT+ Alert rules.
Navigate to GAT+ > Alert rules > Add rule and choose Sink to use.
Result for Generic Receiver (Webhook) #
Once you click Save, an alert is triggered:
- GAT+ sends an HTTP request to the website (webhook.site URL).
- Go to the website (webhook.site URL) in a browser tab.
- You will see a new entry appear.
- Under the “Headers” section on that page, you will see the exact headers you typed into the form (Type, Authorization, etc.), proving that the “Sink” successfully transmitted your configuration.
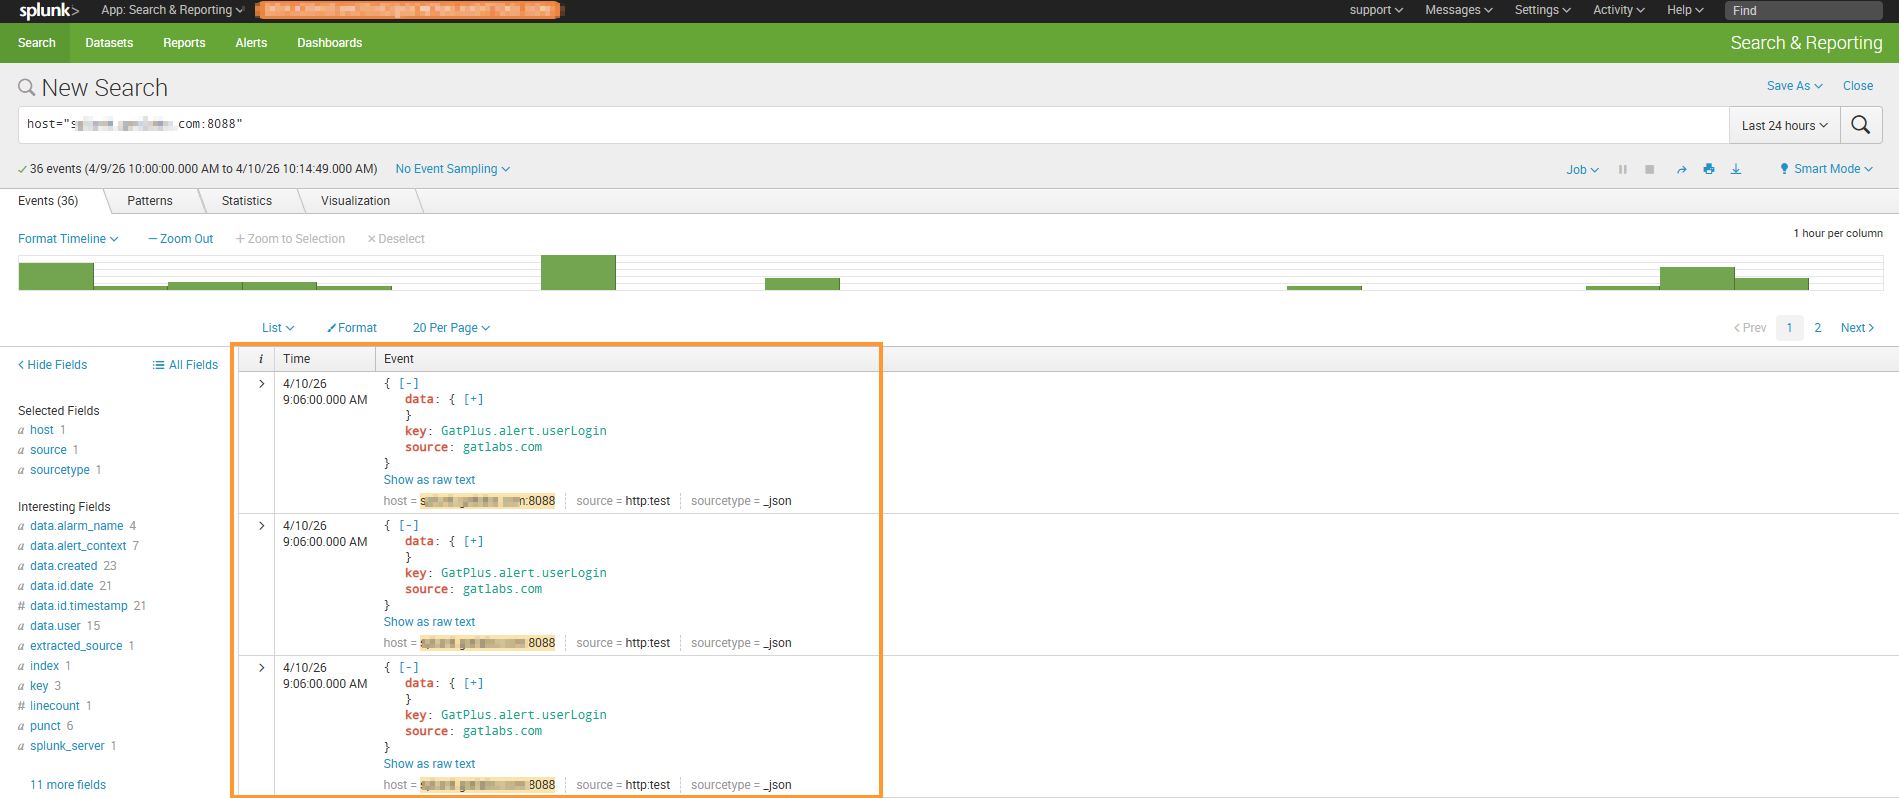
Result in Splunk or Elastic Search #
The results of the Alerts triggered will be displayed in the external service, such as Elastic Search, Generic receiver, or Splunk.
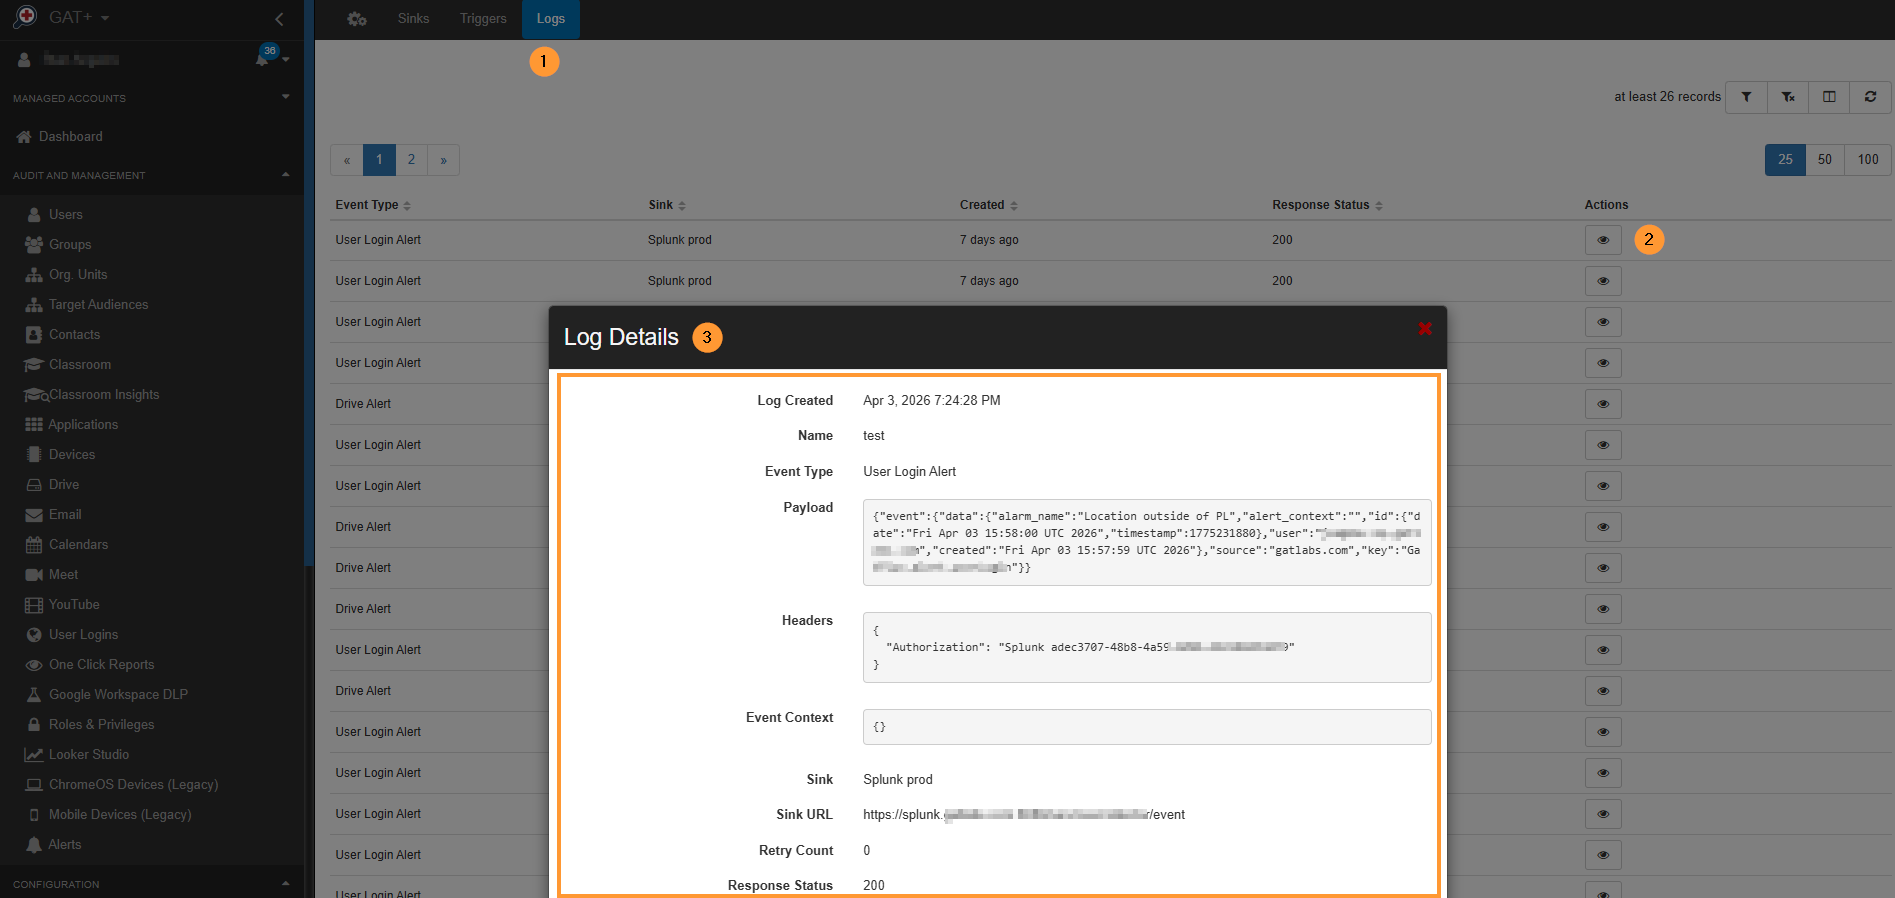
Webhook and Sink logs in GAT+ #
There will be logs in GAT+ confirming that the alert triggered was successfully “synced” to the external source.
The logs can be seen in GAT+.
Navigate GAT+ > Configuration > Wehooks & SIEM > Logs (at top), you will see the logs of the SIEM alerts triggered. View the logs of action that happen with response status, etc.
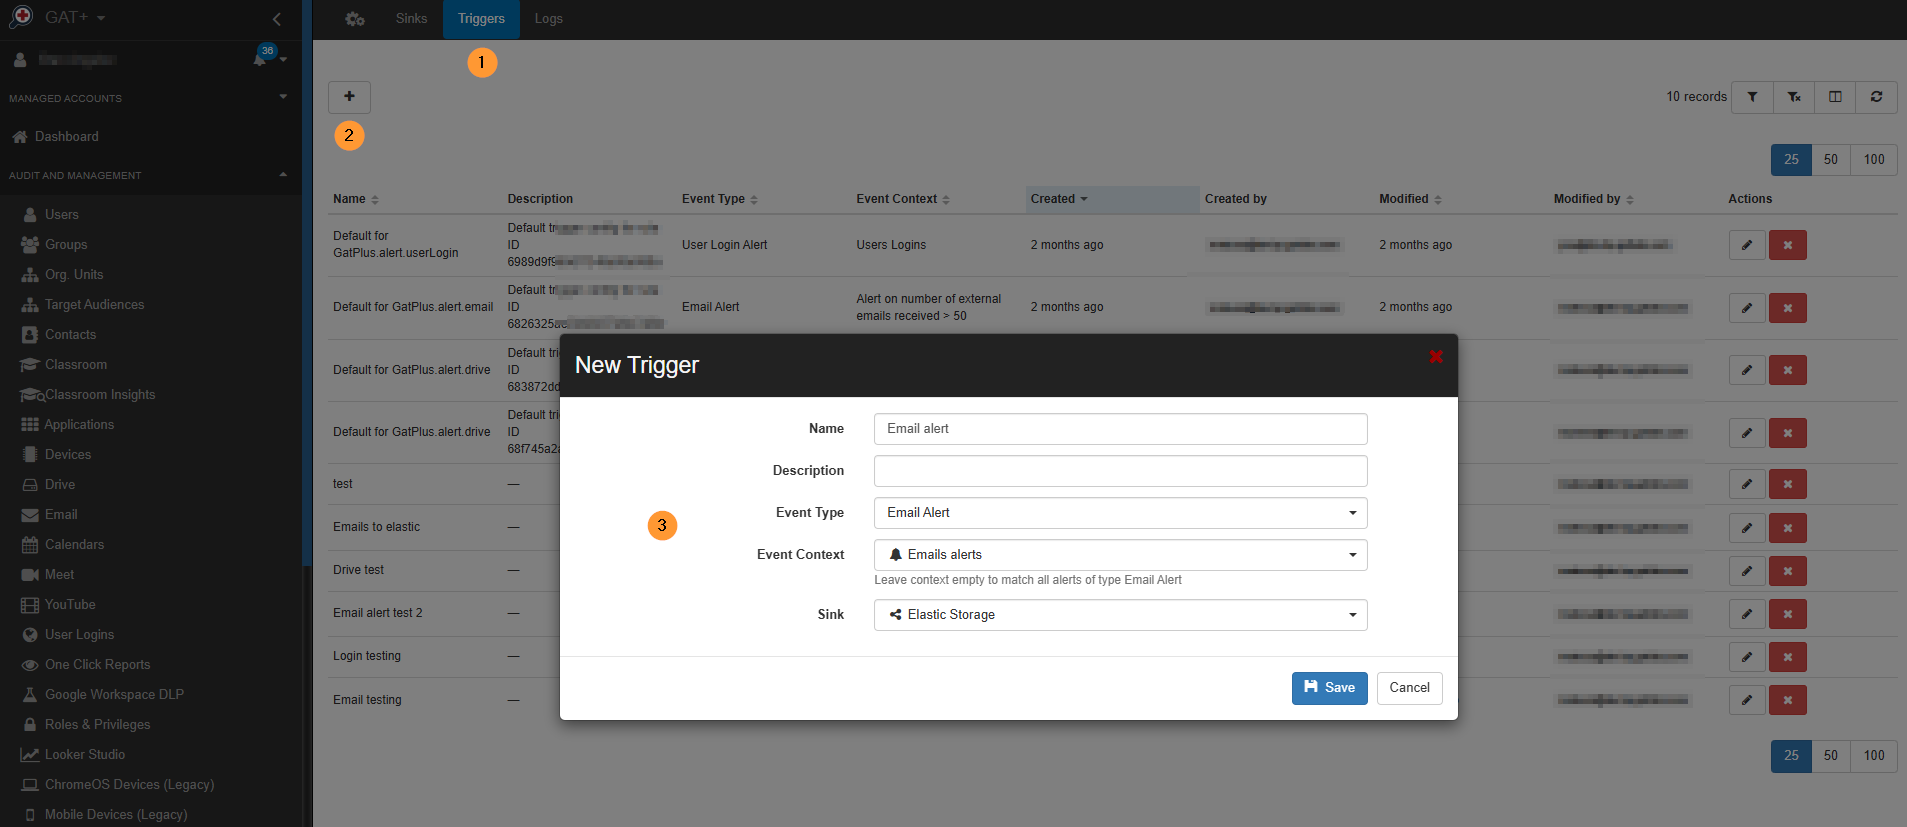
Webhook and Sink triggers #
You can create a new trigger for those webhooks and Sinks.
Navigate to GAT+ > Configuration > Webhooks and Sink > Triggers.
Click the + sign to create a new trigger, then fill in the required information in the pop-up window.
Conclusion #
In today’s complex enterprise landscape, security is only as strong as your ability to see the full picture.
By integrating GAT+ with your SIEM or Webhook receiver, you effectively bridge the gap between Google Workspace and your broader security infrastructure.
This transition from managing fragmented, isolated dashboards to a centralized “Single Pane of Glass” ensures that your team no longer works in a vacuum.
By automating the flow of alerts into tools like Splunk or ElasticSearch, you empower your analysts to move beyond simple monitoring.
Instead of chasing individual notifications, they can now perform high-level correlation, turning “Mass File Download” alerts into comprehensive incident-response stories. Ultimately, this feature transforms GAT+ from a standalone tool into a critical, connected component of your organization’s proactive security posture.
FAQ #
Q1: My Sink is enabled, but I don’t see any data in my SIEM/Webhook receiver. What should I check?
A: First, verify the “handshake” by navigating to GAT+ > Configuration > Webhooks & SIEM > Logs.
- Check the Response Status: A 200 OK means GAT+ sent the data successfully, and the issue likely lies in your SIEM’s indexing rules. A 401 or 403 error indicates an incorrect Authorization Token. A 404 or 500 error usually means the Sink URL is typed incorrectly or the external server is down.
- Check the Alert Rule: Ensure the specific Alert Rule you are testing has the Sink selected in its configuration. An alert must actually trigger for data to be sent.
Q2: Can I send GAT+ alerts to multiple destinations (e.g., Splunk and a Slack Webhook) at the same time?
A: Yes. You can create multiple Sinks in the Webhooks & SIEM configuration page. When you create or edit an Alert Rule, you can select multiple Sinks to receive the notification. This allows you to simultaneously log the event in a professional SIEM like Splunk for long-term compliance while sending a real-time notification to a Generic Receiver (like a Webhook to an external tool) for immediate visibility.


