

What is GAT Shield? #
GAT Shield, part of the GAT Labs product family, is a powerful security, analytical and Data Loss Prevention tool, designed to give administrators deep visibility into the end user activity across the Google Chrome and Microsoft Edge browsers. It provides unique insights, statistics, and monitoring capabilities that help IT and security teams implement effective policies and strengthen Data Loss Prevention (DLP). By capturing detailed, real-time information on what users are doing online, GAT Shield can enable your organisation to enhance its security posture and maintain compliance.
GAT Shield protects Google Workspace environments by monitoring all activity occurring on the users browser profiles. Through continuous oversight and being able to touch the system of the individual users, it can deliver real-time and often critical DLP alerts to the end user within milliseconds. It can then alert the administrator, helping admins detect and prevent unauthorised behaviour, risky actions, or potential leaks of Personally Identifiable Information before they happen.
How does GAT Shield work? #
GAT Shield is made up of two key components:
1. Shield Console Application (For admins): This is the administrative application where the admin can view, analyse, and report on collected data.
The Shield console serves as the central hub for monitoring activity, reviewing alerts, enforcing rules, and gaining insights into user behaviour online.
2. Shield Browser Extension (For end-users): This lightweight extension runs on the end-users’ browser profiles, their main playground and widest attack surface.
Once deployed to the user’s account, the extension begins logging browser activity and will begin sending data back to the Shield console in real time. It captures essential information such as sites accessed by the user and time spent on them, downloads from a website URL alongside other info on the download and other extensions on the browser profile that are running in the background. It can pull the users accurate location data from within a few feet, and other system information on the users machine (CPU model, RAM usage). The extension will also be responsible for blocking websites, and sending warnings to the end user about Personally Identifiable Information (PII) on a web page or email, should it appear.
In short, the extension monitors browser activity in real time, sends data/alerts back to the dashboard, so admins can inspect users behaviour.
Can regular non-admins access GAT Shield? #
No, by default, only super admins can access the Shield console initially. The console contains sensitive information that not everyone should see.
However, non-admin users, can be allowed access to the Shield console by the administrator, which would give them the ability to run audits, analyses, or reports for a select few sections within GAT Shield, within an allowed scope if necessary, within a series of individual users, a group or series of groups, or some specific Organizational Units (OUs).
See our resource GAT Shield: Delegated Auditors Functionality for more information on allowing non-admin accounts to access the GAT Shield console.
Can I try it out? #
Sure! A 15 day free trial is available to all domains.
Shield Prerequisites:
- GAT Shield requires GAT+ to be installed on the domain. If you don’t have GAT+, please install it from here first. It should be turned ON for everyone from the Root OU down. You will be given a free trial of GAT+ automatically, and will be able to access the Shield console afterward
- Before you can see any data in the Shield console, the super admin must deploy the extension to the domain’s end users. See our resource How to deploy the GAT Shield extension on your domain for step by step instructions on how to do that.
If you already have a paid subscription to GAT Labs and would like to try GAT Shield, please contact support@gatlabs.com and they will help you with that.
The paid version of GAT Shield is included with the Secure plan and upwards for Enterprise domains, and as part of the Manage plan and upwards for Education domains, please contact sales@gatlabs.com for a quote.
GAT Shield Modules #
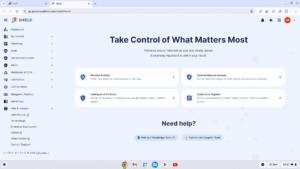
Once launched, the tool will display some options with an introduction page with popular options, and full navigation on the left side panel.
Dashboard #
The dashboard will show the top users activity on the lower end of the page at first view. The last 24 hours are shown by default, though you may adjust that time frame, and also which accounts you would like to see in this dashboard. You may adjust the the scope at the top of the page to show a group, an OU, or a sub-domain of users activity, over your selected time frame.
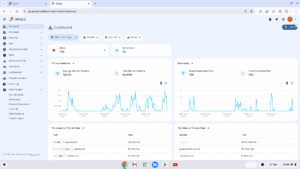
The two graph segments on this page may be changed to chart other graphs, the options available are:
- Active users
- Alerts
- Downloads
- Downloads size
- Extension installs
- Extension removals
- Internal chats
- External chats
- Website visits
- Time on websites
The two list segments on this page may be changed to list other top lists, the options available are:
- Top Categories being blocked
- Top Categories being warned
- Top Extensions by Install
- Top Extensions by Removal
- Top Shield Alerts by Executions
- Top Sites by Site Views
- Top Sites by Time on Sites
- Top Users being blocked
- Top Users being warned
- Top Users by Downloads
- Top Users by Downloads Size
- Top Users by Extension Installs
- Top Users by Extension Removals
- Top Users by External Chat
- Top Users by Internal Chat
- Top Users by Shield Alerts
- Top Users by Site Views
- Top Users by Time on Sites
My Domain #
The My Domain section shows a list of Users, Groups, and Classrooms (for educational domains). Each list shows some information from the domain that may be useful for when you are making changes in the other sections in GAT Shield. Filters can be applied to search for specific user, group or classroom of users.
Reporting #
The Reporting section is where you would go to get graphical reports and charts on a single user, or a group of users browsing activity.
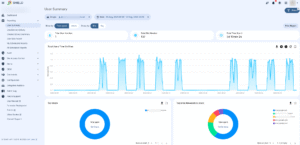
User summary #
The User summary provides a chart view and tables on most visited sites. You can filter the charts by individual users, a group of users, or organisational unit of users, along side a select time frame for which data can be presented.
A user’s total time spent online from their work or school profile, the list of users who spent the most time online, and the list of top sites with the most time spent as a collective group can all be found in this section.
User/Device activity #
User device activity measures the browsing activity for the selected users in the chosen time. View a chart for all pages visited by the selected user and total time spent, or time spent on individual webpages.
The detailed information shows a graph view of the time spent and the date for each webpage visit.
Chrome Device Summary #
The Chrome device summary shows a chart view for the browsing activity on the devices in the selected time frame. View total number of devices as well as site number and tital time spent over the chosen time frame.
View the total device time on sites ,as well asthe Top devices and Top users on devices. Top sites browsed on devices and Devices time on sites, all of this for the scope of devices and time frame picked.
User Geo Report #
This shows a Map with locations pointed to users’ activity. You can filter for a date and time as well as the scope of users you want to audit.
My scheduled reports #
This shows a list of all scheduled reports created by the Admin themselves.
All scheduled reports #
This shows all the scheduled reports of GAT Shield created by any of the Super Admins
Audit #
The Audit section provides the audit of the browsing activity of the Shield users.
Browsing #
Browsing shows the full browsing activity of the domain users. View the Top browsed domains in a pie chart view. Average time on websites, as well as top user by time on sites, and a pie chart or table list of the top users.
View all the users and the browsing activity done by them, such as the websites they visited for how long and website domains, and the times of start and finish of the browsing, all in the selected time frame chosen.
Cookies #
View all the cookies used by users.
Downloads #
View the downloads done on the Chrome browser in the chosen time frame. View and filter for any user and download details information.
Extensions #
View all the extensions that the users of the domain are using, along with their details.
Extension events #
View the events for the users and the extensions they use. Filter by the Event type of Enabled, Disabled, Removed, or Installed
Searches #
View all the searches done by the users on the selected date. You can view the User and the Query they applied, as well as what Search engine they used, as well as the date extension version and Chrome version.
Chats #
View the Google chat information, who is chatting with whom, view the participants and the duration of the chat when it started and finished, and more information. You can also filter by time for this data. The data can also be set up as a scheduled report.
User/Device Geo Reporting #
GAT Shield will Preview on Map – Preview the current records shown in the table on the Map
View a list of users and the networking information for each user, such as IP addresses, devices used, Country or City the user logged in from.
Login Control Events #
This show a list of events for Login control feature of GAT Shield. It provides a list of users who broken the rule of Login control and additional information.
See how to configure Login control here
Site Access Control #
Site Access Control is the web filtering portion of GAT Shield. This allows you to apply block rules for the users of the domain, thus blocking webpages for the users. This can help keep your organisation compliant and GAT Shield has over 90 pre-defined categories, allowing you to block thousands of sites from a given category in just a few clicks.
You can learn more about Site access control here
User defined categories #
Here you can create a list that acts as a category of sites to be blocked. Create a category via list, spreadhseet, websearch or recent browsing. Once the list of pages to be blocked is created can it be activated and applied for any or all users of the domain.
Predefined categories #
List of predefined categories of sites that can be blocked for all users in bulk. Select any of the categories and simply enable it for a set of users.
There are some special categories that can also be applied.
- All – All URLs are blocked when a Block Rule is created using this category.
- Public or Private IP addresses
- Google Translate block – All translate.goog subdomains are used by Google Translate to translate whole pages.
Rules #
Here you can test rules and view if the rule is applied to any user. Allow/Block websites is a quick way to block or allow any webpage for any of your users
View all the rules that are created, you can view if they are currently active or not, and what category they are part of, as well as their name, and what action is enabled to block or allow pages.
Block Partial content on Pages #
Apply a block to partial content on webpages.
For example
- Google Translate widget on Google search
- Block the comments section on YouTube
- Remove the related videos sidebar on YouTube
- Block games embedded into Google Search
Events #
View all the different events that are triggered by the Site Access Control. View the list of users who broke applied rules. Filter by a date format.
Block page configuration #
- Visibility of the name of the rule (that blocked the page) on the blocking page
- A message that would be shown to the user while blocking the page on the device.
Alerts #
Alerts allow the Admins to create real-time alerts for the end-users. There are many types of alerts that can be set up.
Rules #
There are different rules that can be set up for the users.
- Device
- Device user/owner mismatch
- Download
- Page content inspection
- IP address
- Location
- Search
- Upload
- Visit
Each alert works differently and reports different types of user activity.
Notifications #
This will show the result from all the Alert rules that are set up in GAT Shield.
Commands #
Commands can be set up, and messages and commands pushed to the end-users.
Defined commands #
This site allows you to define commands that will be sent to users’ extensions.


