
GAT Shield is an extension that provides the Google Workspace Admin with a data loss prevention (DLP) solution for their domain.
With Shield Admin can measure and monitor the Students’ behavior and browsing activity while using their student accounts and logging into the domain via Chrome browser.
Using GAT Shield an admin can view and track the browsing activity of Google Classrooms.
View browsing activity #
Navigate to Shield → Audit → Browsing → User summary
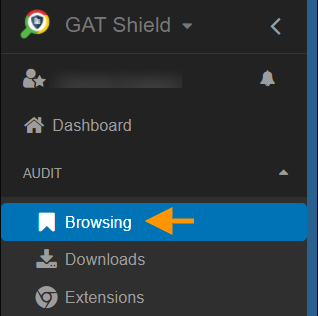
This will display summary data for the browsing activity of the Users.
You can apply different filters to extract the data needed.
- Time range – select the needed time range
- It can be Today, Last day, Last 7 days, Last 28 days, This month, and Custom
- Scope – select what are the users you want to gather Browsing activity for.
- It can be Domain, User Org. Unit, User group, Classroom, User or Device OU
- Select Classroom – pick the classroom needed
- Click on Load/Refresh – to filter the result
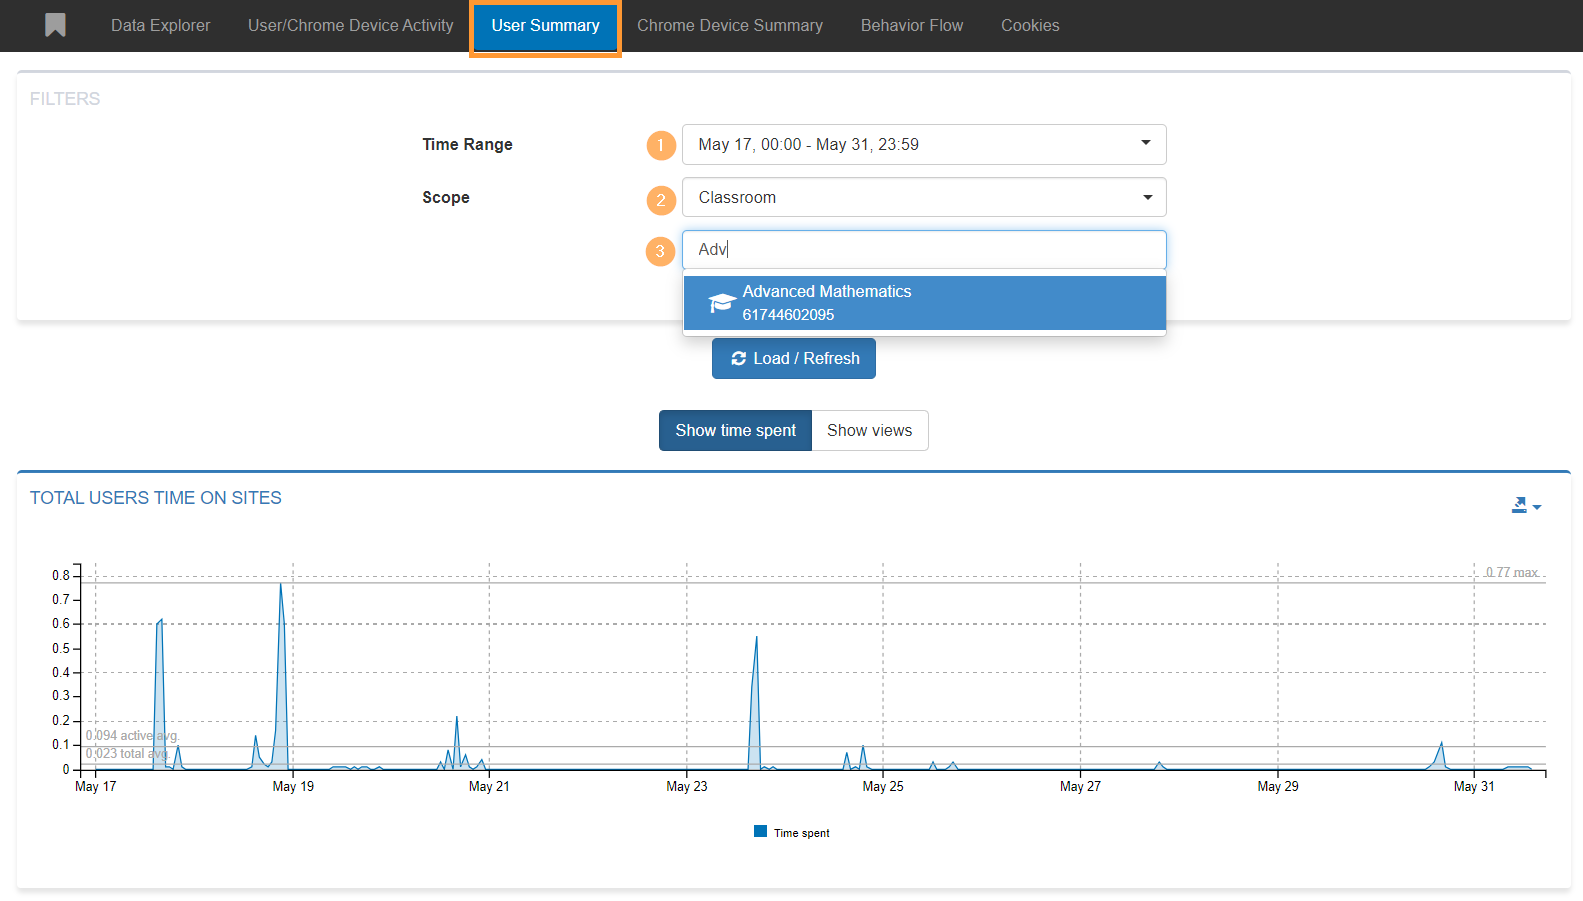
The browsing activity will be displayed below.
Show time spent #
- Total user’s time on sites – a graph view of all users under the selected scope and the users who were active
- Top Users – list of all the users under the selected scope and the time each user spent, hoovering over the chart will show which user spend that time browsing
- Top Sites browser by Users – List of sites that were visited, combined by the team each user spent on the specific site
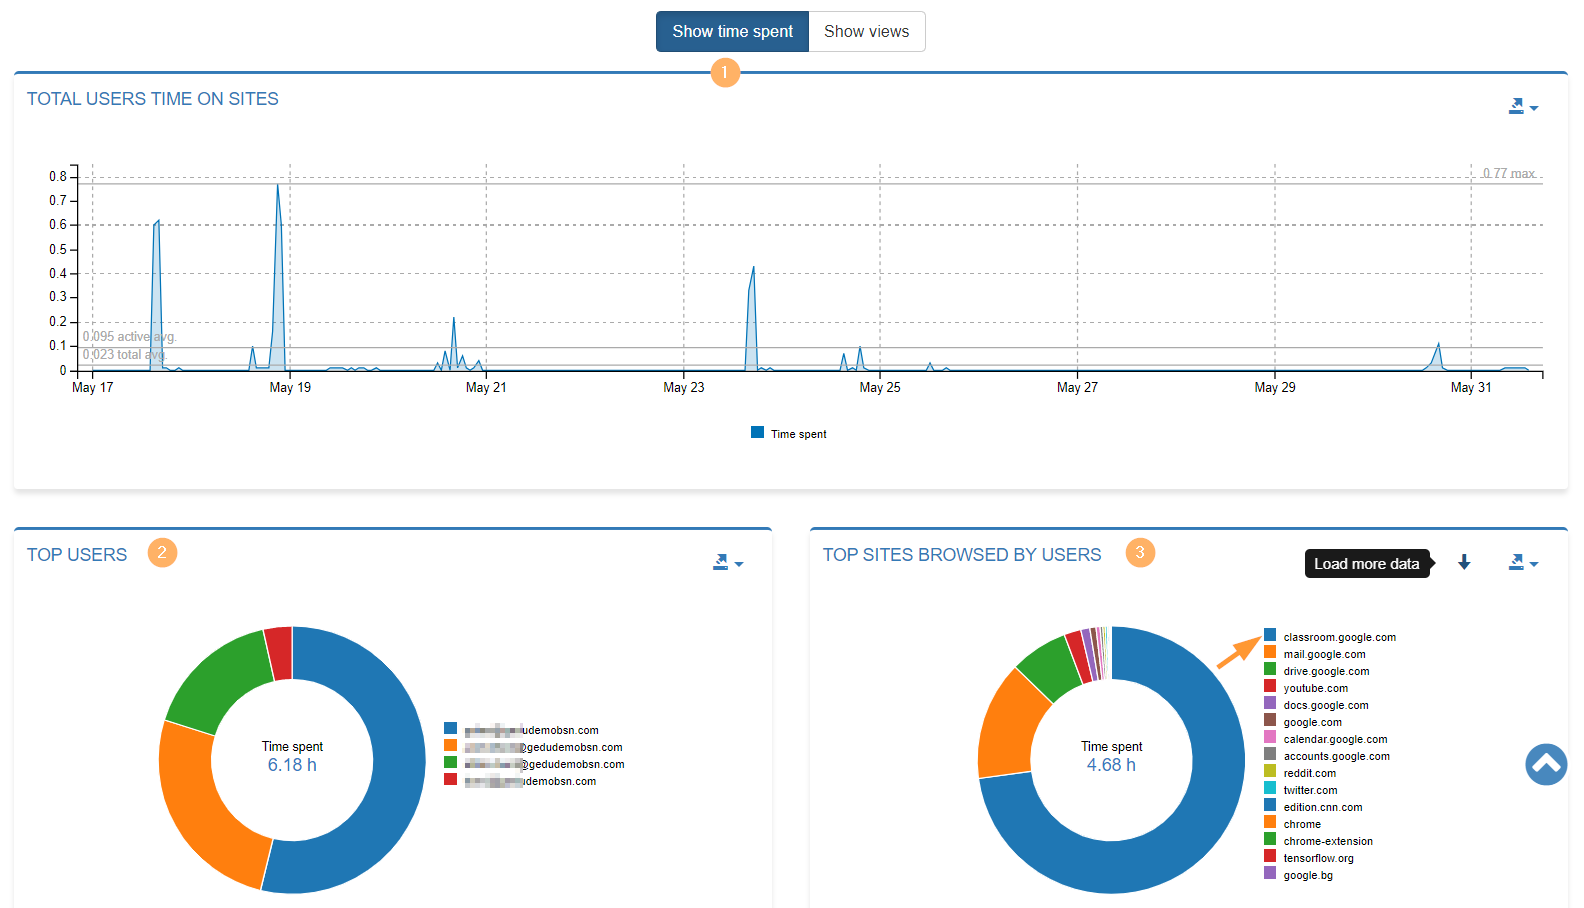
Note: The charts can be exported into a PNG or CSV file
Filter by classroom activity #
View the browsing activity for the site “classroom.google.com” for all the students under the selected classroom.
Top sites browser by Users find the Classroom site – classroom.google.com
Hovering over the pie chart you can view how long the users spent browsing the webpage.
You can view the classroom users’ activity at classroom.google.com
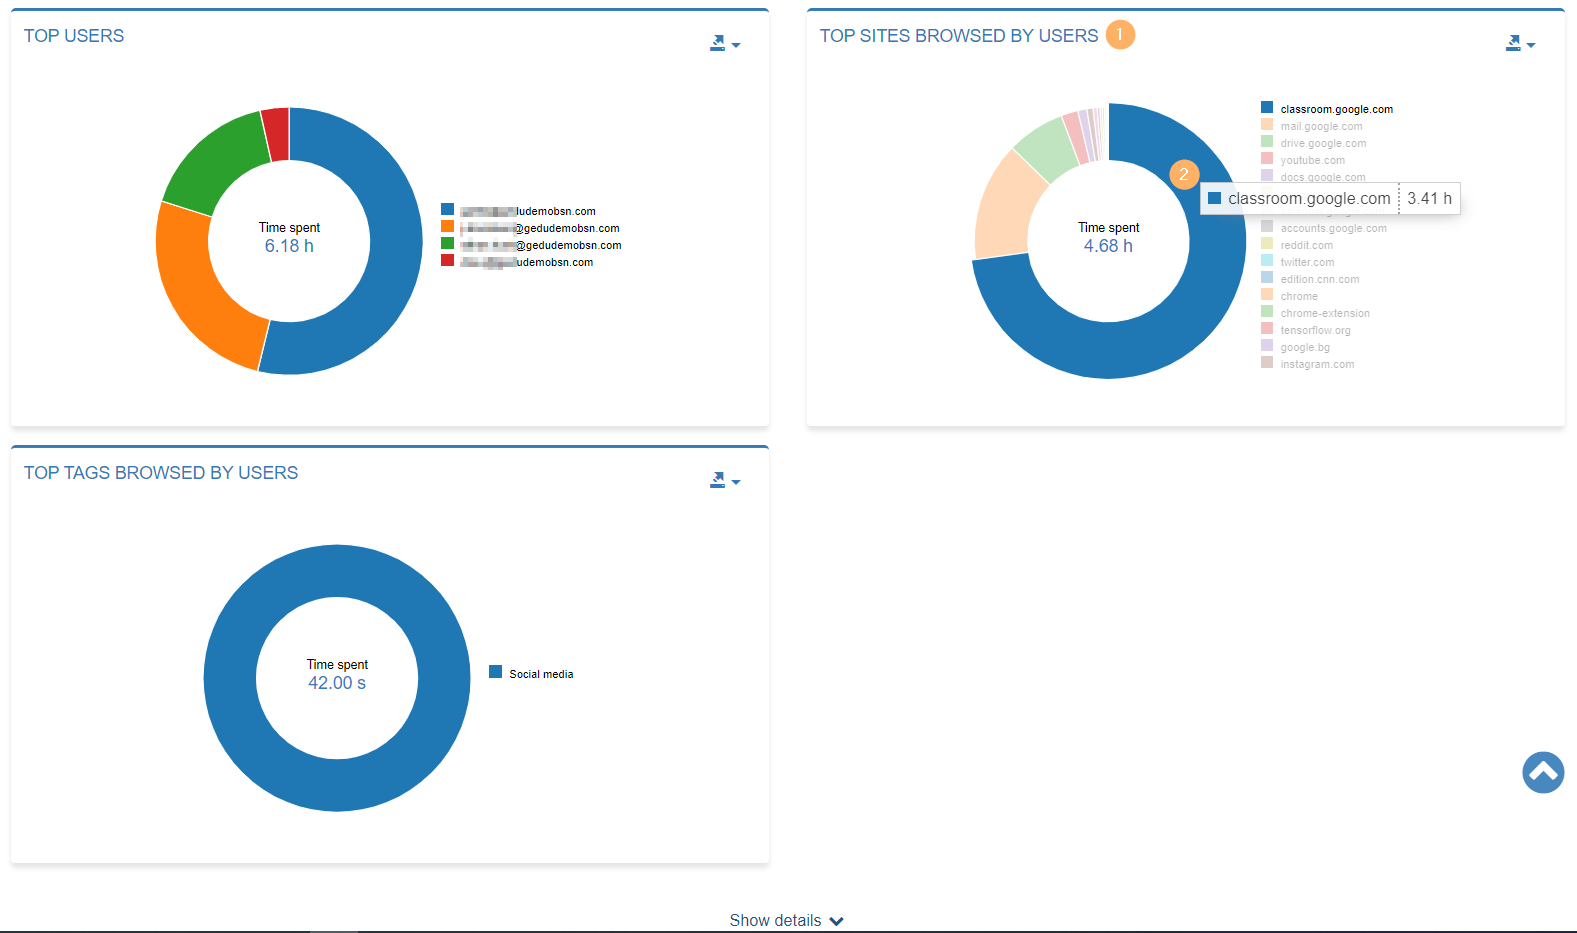
Top Tags browsed by Users #
If you have a Browsing tag created, in this chart you will view the browsing activity of the chosen scope of users and the time spent on each Tag.
As an example, if there is a Tag created for Classroom ( click here for more details)
Show views #
Show viewers will show charts with the number of views on the sites done by the users of the selected scope
- Total user site views – hoovering over the chart will show the time and views on the site done by the users
- Top users – List of users, and top users filtered by number of views
- Top sites browser by users – chart of sites filtered by number of views for each site visited

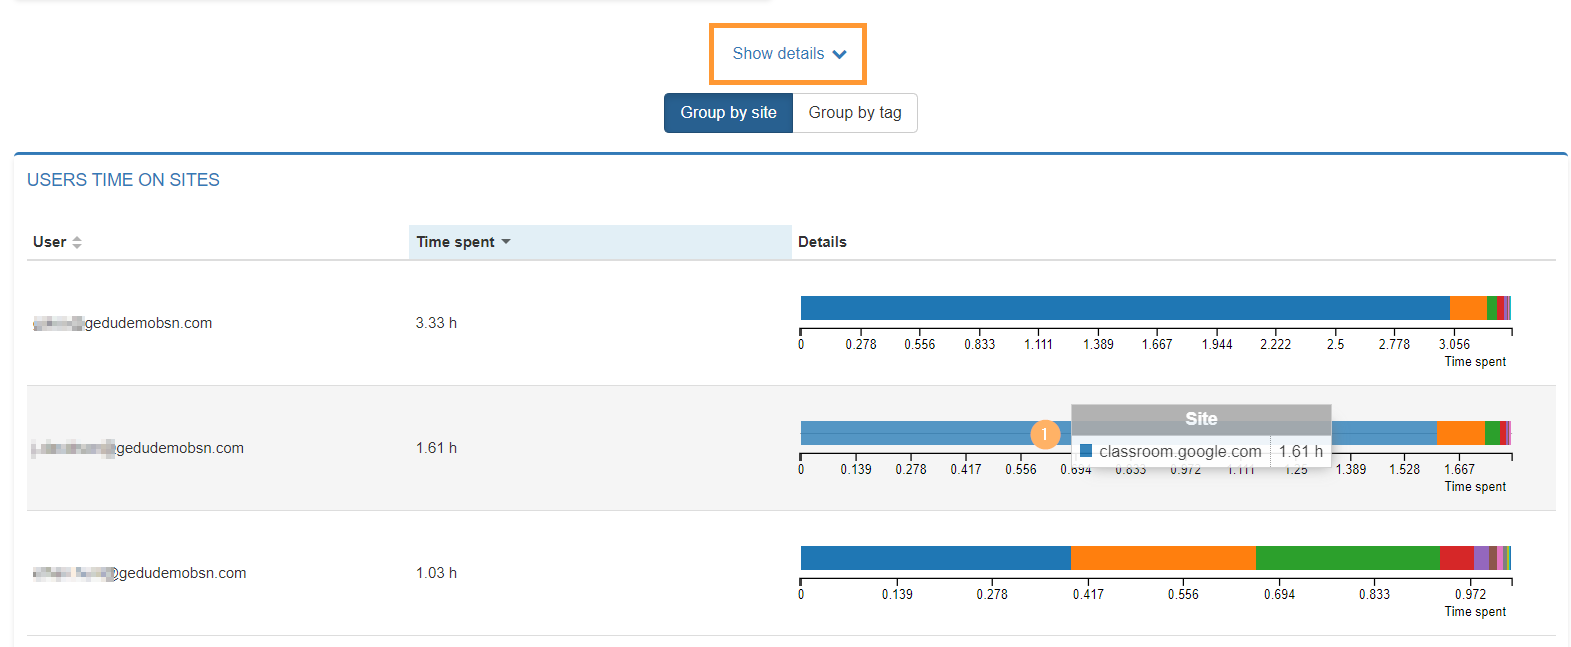
Show details #
Clicking on the Show details – at the bottom of the charts will display a detailed view of the selected tab above Show time spent or Show viewes
- User – user email
- Time spent – time spent for the selected time range
- Details – detailed view for each student where they spent their time browsing
.


