

High CPU or memory usage is more than just a performance headache; it is often an early warning sign of browser-based attacks, crypto-mining scripts, memory leaks, or bloated web apps running in the background. If an employee visits an infected site, a stealth web-miner can quietly drain system resources and compromise device integrity.
With Shield+, Google Admins can continuously track browser-level resource metrics across their organization. By setting threshold-based rules, such as flagging sustained CPU usage over 85% for more than 15 minutes, Admins can instantly spot rogue processes, isolate malicious tabs, and use historical CPU and memory telemetry charts to make data-driven fleet optimization decisions.
Follow the step-by-step guide below to configure performance rules and access user resource audits.
Set up a device performance rule #
Navigate to Shield+ > Security Configuration > Device Performance > + New performance rule
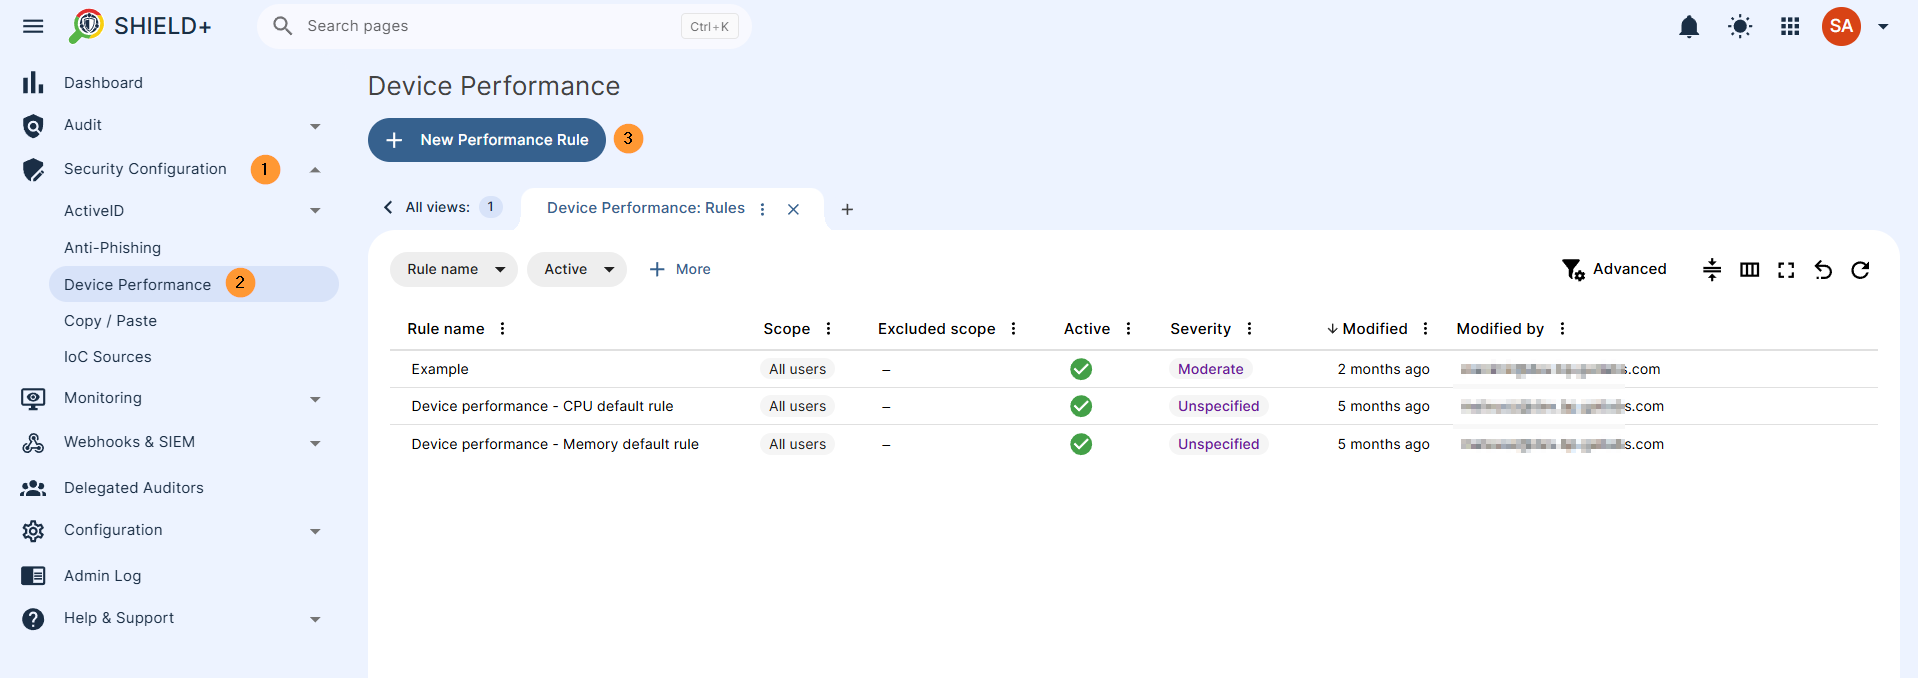
Create the rule by following the steps required.
- Name – enter a name for the rule
- Severity – select the severity for the alert
- Scope – select the scope for what users the rule is for.
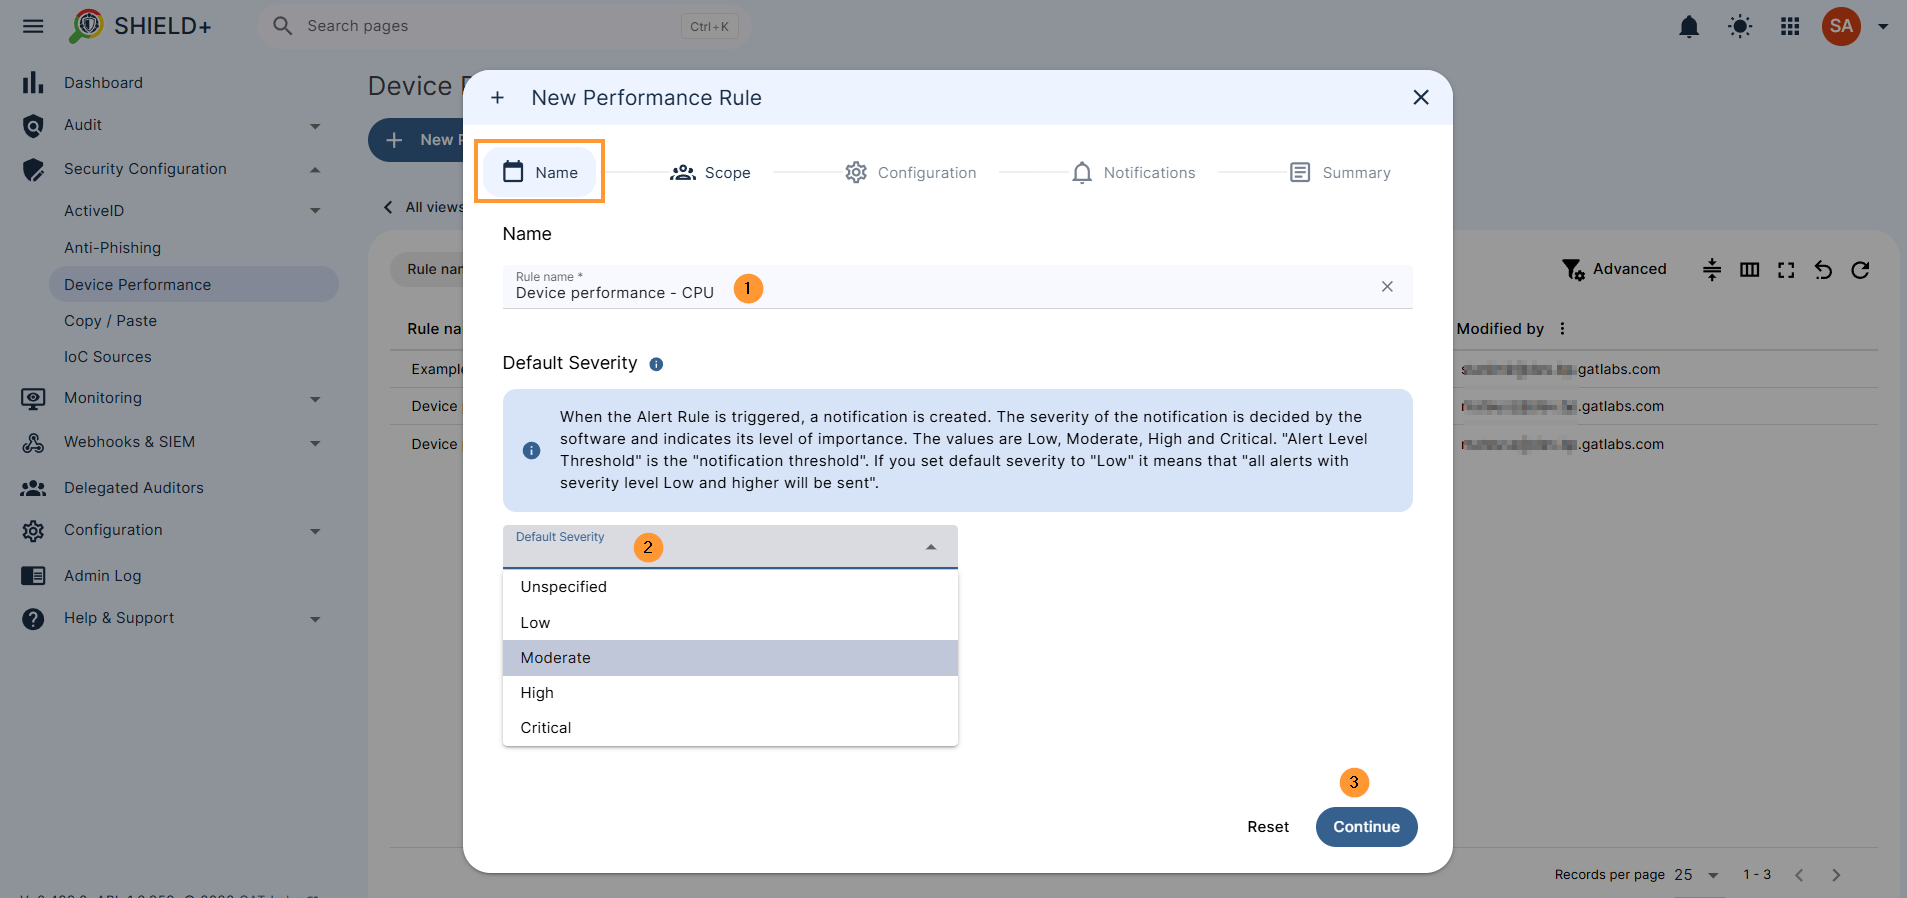
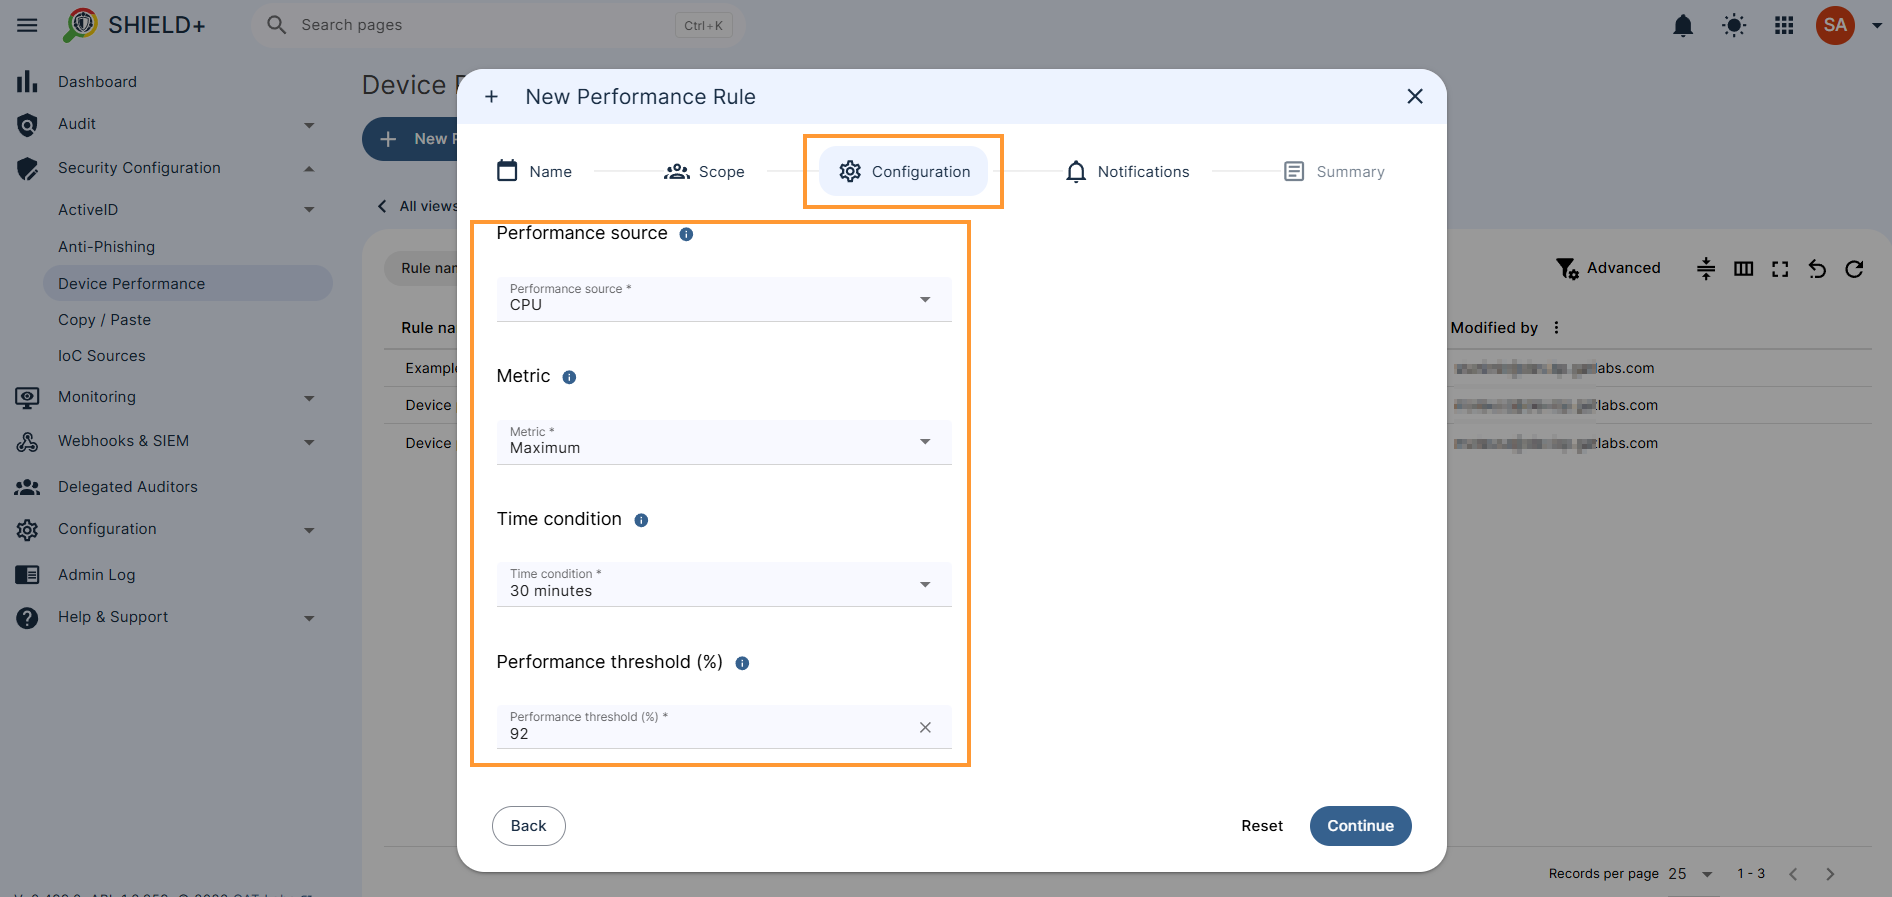
- Configuration – select the performance you want to create the rule for
- Performance source – Check performance of the selected resource
- CPU
- Memory
- Metric – Check the performance metric for maximum or average values
- Maximum
- Average
- Time condition – Condition holds “true” for at least X amount of min
- 15 minutes
- 30 minutes
- 60 minutes
- Performance threshold (%) – Checks if the selected measurements are above the given threshold for a given time
- Enter the performance threshold in percentage
- Performance source – Check performance of the selected resource
- Notifications – select alert recipients
- Webhooks & SIEM – select webhook or SIEM
- Screen capture – select screen capture
- Attach website name – toggle on/off to attach website name in the notification
Click on Continue, review the summary of the performance alert, and create the rule.
Device performance result #
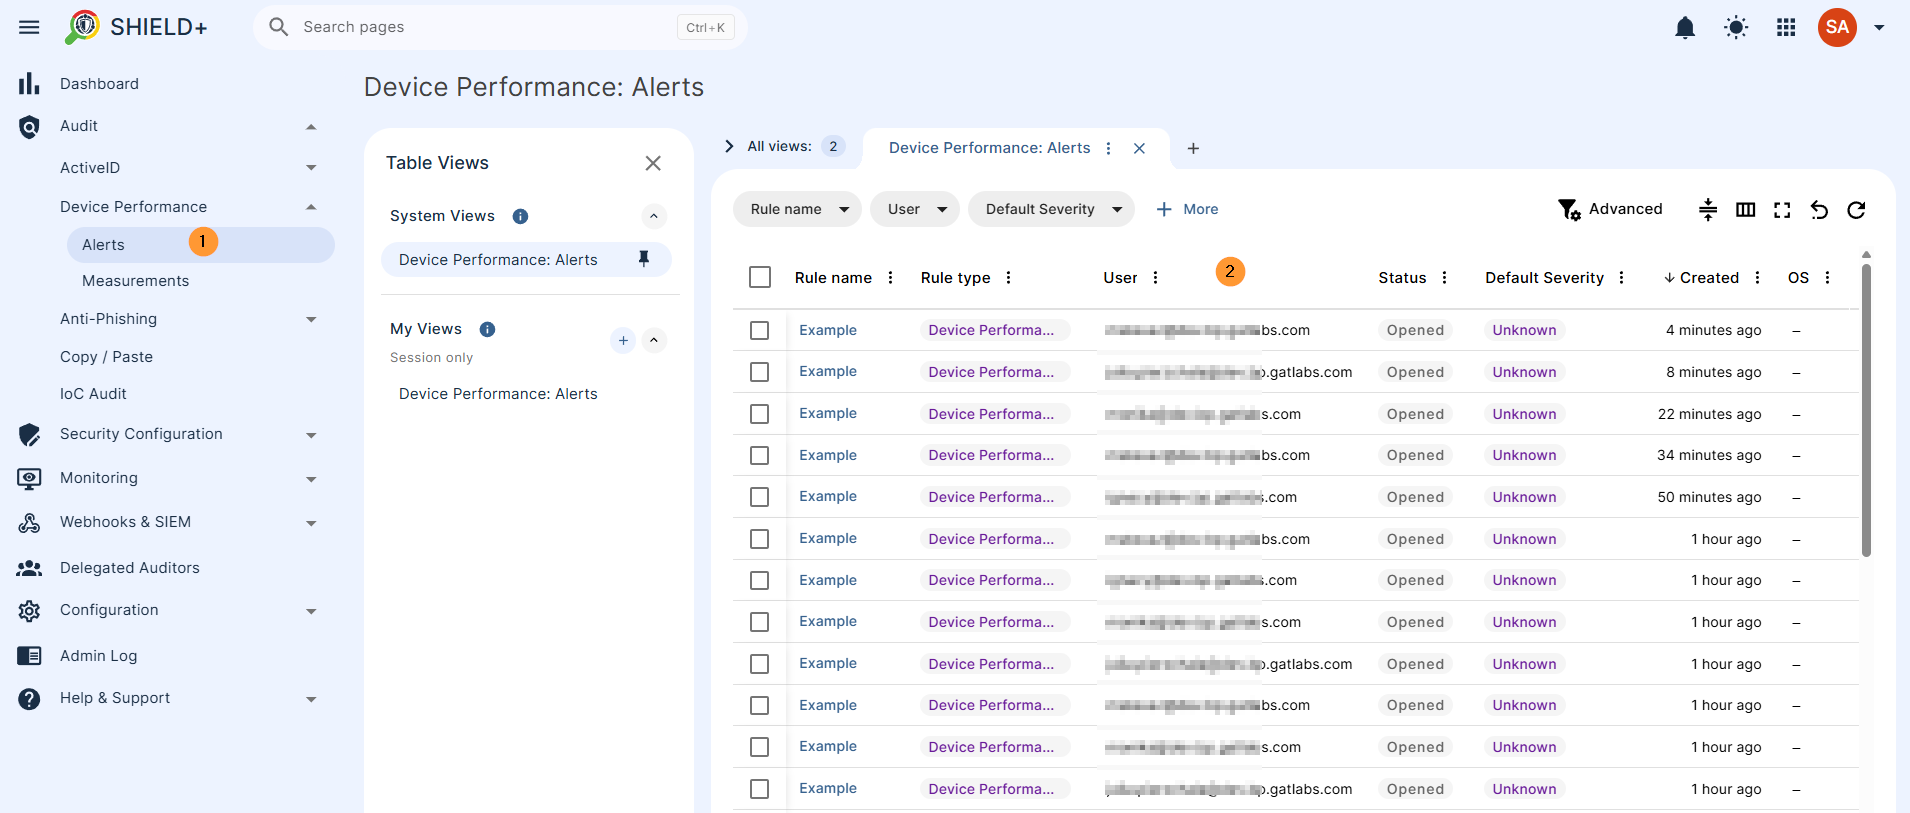
Device performance is measured by the stats of alerts raised when a user’s device CPU or memory usage exceeded a configured threshold for a sustained period. Each alert records the affected user, the resource (CPU or Memory), the metric (Maximum or Average), and the duration.
- Alerts – Alerts are raised when a user’s device CPU or memory usage exceeds a configured threshold for a sustained period. Each alert records the affected user, the resource (CPU or Memory), the metric (Maximum or Average), and the duration.
Navigate to Shield+ > Audit > Device performance > Alerts
- Measurements – Raw performance readings collected from user devices over time. Individual records can be expanded to view CPU and memory measurement charts for a detailed history of a device’s resource usage.
Navigate to Shield+ > Audit > Device performance > Measurements
Hover over any user and, on the right side, click on Measurements charts
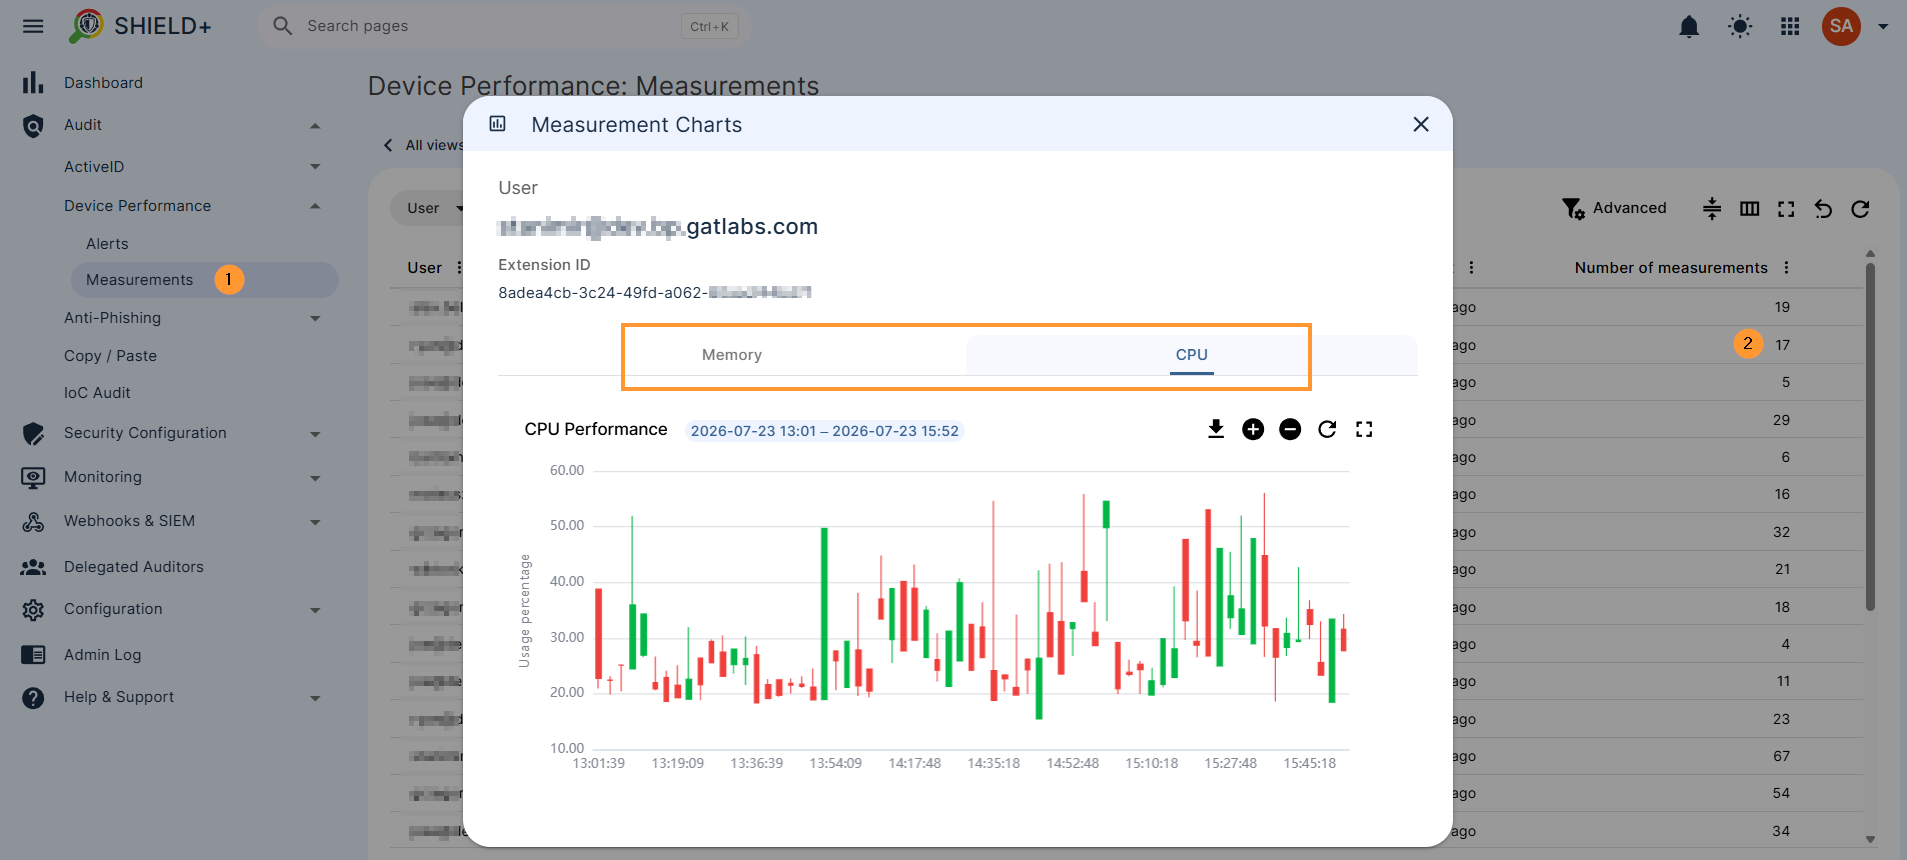
The chart will show the Memory and CPU performance for the selected user. The chart can be downloaded as JPEG, PNG, or CSV.
By continuously tracking endpoint resource usage right inside Chrome, Shield+ bridges the gap between IT operations and proactive threat detection.
Extreme CPU spikes and memory drains aren’t just technical annoyances; they are often early warning indicators of cryptojacking scripts, browser exploits, or rogue web extensions running in the background.
This feature provides Google Admins with three key operational advantages:
- Early Threat Detection: Automatically spot and isolate browser-based threats (like crypto-miners or malicious scripts) by flagging sustained resource spikes before they can compromise the device.
- Granular Rule Customization: Fine-tune alerts based on specific parameters, such as average vs. peak consumption over customizable timeframes, ensuring you catch genuine anomalies without triggering false alarms.
- Proactive Fleet Optimization: Use historic CPU and memory telemetry charts to audit device health, identify resource-heavy enterprise web apps, and make data-driven decisions on hardware refreshes across your organizational units.
In short, Shield+ elevates performance tracking from basic troubleshooting into a strategic security and fleet management tool, helping you maintain peak user productivity while keeping endpoints secure.


